I’ve written a couple of times on the subject of boot loaders and full disk encryption, but I haven’t really explored it in more detail. With this blog post I hope to dive a bit deeper into how to actually start performing these type of analysis and why they are useful to perform. I’ll start with the usefulness first and then go into the part on how to do it, but will not be fully reversing a disk encryption boot loader. I won’t be doing a lot of hard-core reversing like finding vulnerabilities within the cryptographic operations or reversing custom filesystem implementations, but hopefully provide enough information to get started in the area of reversing unknown boot loaders.
The type of products with which you can use the approaches and techniques described in this blog post are the most useful when applied to full disk encryption (FDE) solutions that are configured to not require pre-boot authentication. The reason being, that you then could potentially obtain the disk decryption key. If the solution requires pre-boot authentication, the information that you can obtain, might be reduced to meta-data or ‘deleted’ files. Which brings us to the whole, why are these type of analysis useful?
The reason of why this is useful, I didn’t fully realise until a couple of years ago when a colleague introduced me to the wonders of all the (hidden) information that FDE solutions may contain. Let’s look at the type of information that you may encounter while investigating these solutions:
- (encrypted) Hidden file systems
- (obfuscated) Encryption keys
- Usernames
- (hashed/encrypted) Passwords
- Windows domain credentials
- Configuration information of the FDE solution
- Files marked for deletion
- Finding 0days and bypassing encryption
Based on the above list of items we can pretty much conclude that analysing FDE solutions is useful from an offensive as well as from a defensive point of view. It can either help us to breach a target network or obtain sensitive information as well as collect forensic evidence or aid us into understanding the specific cryptographic implementation to enable us to decrypt the disk and analyse it. The helper tools I’ve used in this blog post can be found here. Keep on reading if you want to know the rest of all the details and the process I usually follow. I’ll try to describe the following steps:
- Creating a (partial) copy of the disk
- Analysing the disk
- Static & dynamic boot analysis
Since I don’t have easy access to disk encryption software with the exact features I’d like to analyse I’ll be using DiskCryptor as an example product.
For some reason it seems that the products with the most interesting features to reverse engineer have a horrendous ‘request trial’ process as well as not providing trials to a random researcher on the internet :( sad panda :(
The other reason to use DiskCryptor is the fact that it is open source, thus enabling people that want to get started with type of stuff to more easily understand difficult snippets of assembly. My personal approach to a lot of reversing challenges usually revolves around finding a similar open source variant first or finding the open source components used in the proprietary solution if applicable. Reason being that it makes your life a lot easier to understand not only general concepts, but also specific code quirks. A very nice explanation on finding as much information as possible before your start reversing is given by Alex Ionescu in his offensive con keynote ‘Reversing without reversing’.
Oh and there is no specific goal, besides just explaining my general thought process. As a side note I am no reverse engineering expert, so feel free to correct me :-)
So where to start? I start by just looking at it, observing the boot process and trying to identify if anything recognisable flashes on the screen. You’d be surprised that sometimes a *nix shell has been developed to tie together the actual encryption and decryption (COTS) components.
After observing the boot process you might have obtained some strings or a logo to Google for, which ideally results in the ability to read up on the product. Reading up on the product and then using Google dorks or FTP search engines can result in the ability to obtain a copy of the product, the technician documentation or even the technician disaster recovery tools. The latter are usually much nicer to work with since they might not have been stripped of all symbols and easier to reverse engineer, due to reduced functionality that they include.
When that doesn’t work the next step involves trying out a couple of keyboard combinations during the boot process with the goal of identifying additional functionality. The keyboard combinations to try out can be related to Windows and *nix, but don’t forget to also randomly bash on your keyboard and try out other forgotten combinations. All these actions can results in a variety of interesting behaviour ranging from ‘nothing happens’ all the way to ‘hmm this looks interesting’.
Disk imaging
One of the first things I usually like to do is create an image of the disk that I want to analyse. The reason being is twofold:
- You can’t mess up the original data
- You will very quickly know if it is tied to hardware when emulating
There are a couple of ways to create a disk image, the most known/popular one is of course to use dd. If you google around you’ll see examples like this:
dd if=/dev/sda of=disk-sda.img bs=1M conv=noerror
The above, while being complete, has one drawback you’ll end up with a file of the same size as the original disk. This can be very inconvenient when dealing with large disks. Ideally you’d like to have just an image of the data involved. To be able to do this I adjusted an existing FUSE example to save sectors and play them back when needed.
If we want to create an ‘image’ of all the sectors that are used until Windows boots we would do:
python emulate_partial.py ~/disk-images/ mountpoint/
This would create files with the content of the read sectors in ‘/tmp/datadir_storage’ which can be changed using the ‘–datadir’ option. If we then want to emulate the boot process with the saved data we would do:
python emulate_partial.py --emulate ~/disk-images/ mountpoint/
This would read the contents of the saved sectors, thus emulating the boot process. In case you are already thinking of other use cases, yes you can use this to fuzz all code that reads and manipulates data from the disk.
The size difference is very nice, during my tests I only needed 34M of data to emulate the boot process versus the 20G I would have needed otherwise. It could have even been less than 34M, but I wanted to at least load a couple of Windows files.
Disk analysis
Hopefully after the previous steps we’ve obtained at least the type of product that we are dealing with and we’ve read up on it or even played with some of the tools we found online. The next step would be to analyse the disk. Does it contain unencrypted parts? Does it contain partitions with interesting files on them? Like you can imagine this requires looking at the disk, which is a relatively easy task. Unfortunately I don’t have software at hand which uses hidden partitions, in part due to the horrendous vendor trial request process :( Nonetheless, here are a couple of things that I usually do:
- Run fdisk on the image
- Look specifically for discrepancies between offsets and total size
- Run binwalk on the image
- Manually verify the results
- Run strings on the image
- Everything after the MBR and VBR should be garbage output, readable strings indicate potential interesting sectors
Lastly I also compare the sector read offsets with the partitions that I saw with fdisk:
fdisk -l ~/disk-images/dc-bios.img
Disk /home/dev/disk-images/dc-bios.img: 20 GiB, 21474836480 bytes, 41943040 sectors
Units: sectors of 1 * 512 = 512 bytes
Sector size (logical/physical): 512 bytes / 512 bytes
I/O size (minimum/optimal): 512 bytes / 512 bytes
Disklabel type: dos
Disk identifier: 0x688409a1
Device Boot Start End Sectors Size Id Type
/home/dev/disk-images/dc-bios.img1 * 2048 206847 204800 100M 7 HPFS/NTFS/exFAT
/home/dev/disk-images/dc-bios.img2 206848 41940991 41734144 19.9G 7 HPFS/NTFS/exFAT
For that I use a FUSE wrapper to which I added some print statements, example output:
python wrap_directory.py ~/disk-images/ mountpoint/
r /dc-bios.img 0 16384
r /dc-bios.img 21474811904 4096
r /dc-bios.img 21474816000 16384
r /dc-bios.img 21474832384 4096
The above output shows that apparently DiskCryptor stores some data at the end of the disk? How do I know this? If you convert the offset to sectors (21474811904 / 512 = 41942992) you immediately see that the sector offset is beyond the last partition, but before the total amount of sectors for this disk. An important piece of information to keep in mind is the fact that the QEMU sizes could be different than the read sizes used in the boot process by the software itself. For this stage of the analysis it is not that important, but it could still throw you off.
The above described analysis steps could yield a variety of results like discovering a hidden partition or not discovering anything at all. Depending on the results you can decide to continue with either static analysis of the boot loader or dynamic analysis of the entire boot process. Depending on what you are after. Although in my own experience you usually end up doing both at the same time, since that makes life much easier.
Static & dynamic boot analysis
To start our static boot analysis we need to get a copy of the MBR which contains the boot code. We can obtain the code by performing the following command:
dd if=dc-bios.img of=dc-bootsector.img bs=512 count=1
We can now analyse this with our favourite tool, in our case we will be using Ghidra to learn how to work with the tool. If you haven’t set it up already you can follow the instructions over here. First we’ll create a project and then we either do ‘File->Import File’ or we press ‘i’ and after selecting the file we just made, we should have the following screen in front of us:
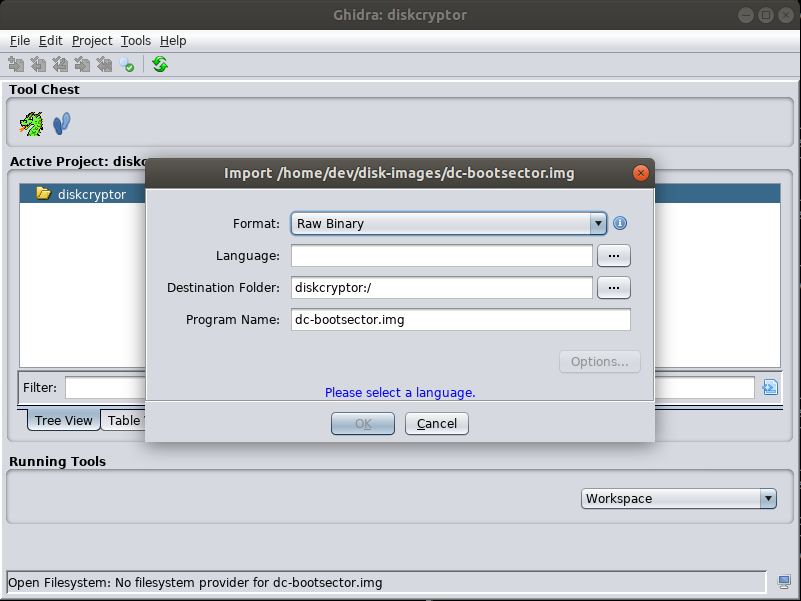
The language option we set to ‘x86:LE:16:Real Mode:default’ and then we hit the ‘options’ button and only change the base address to ‘0000:7c00’. Our boot loader has now been imported and if we double click it, the code browser opens and we see a lot of gibberish (it doesn’t really matter if you auto analyse it). We now place our cursor on the first instruction and hit ‘d’ or right click and choose ‘Disassemble’ which will magically show us assembler on the left and pseudo-code on the right:
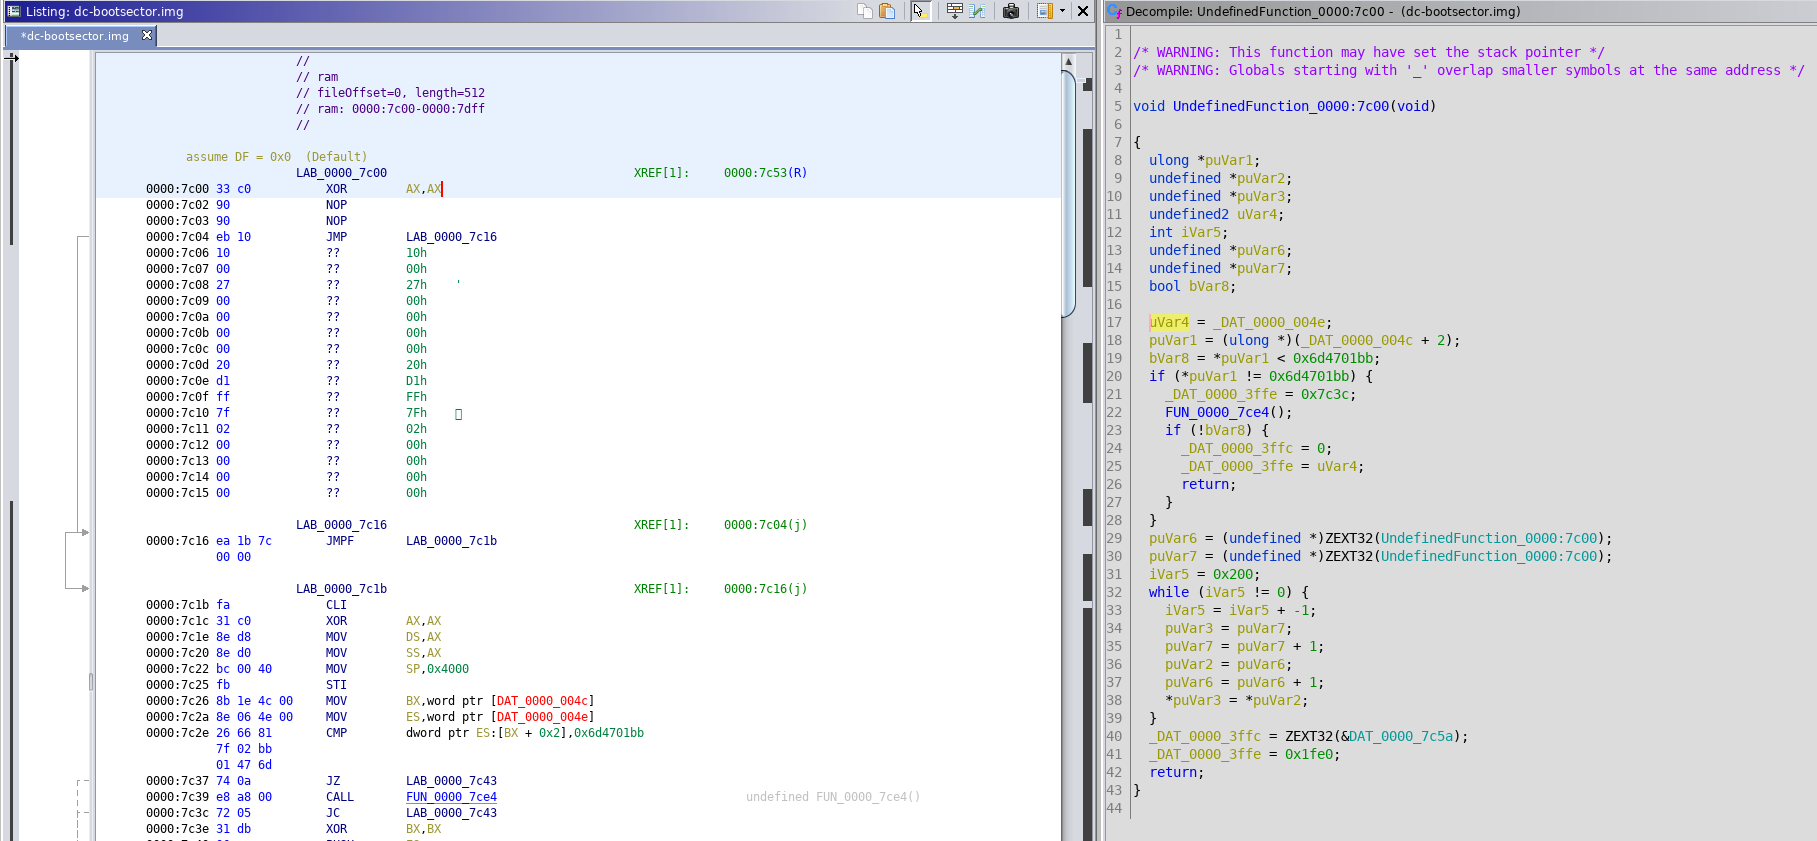
With this in front of us we can start to better understand what the code does. Before we dive in, it would be good to know what a regular boot loader does right? I’d suggest to read this excellent blog post which does a really good job in explaining the code line by line. This ensure we are at least ready to recognise some code constructs like code that copies the MBR to a different memory address. A couple of things peeked my interest:
- The compare with a fixed value @ 0000:7c2e
- The call @ 0000:7c39
- The code block at 0000:7c43
The way I usually deal with unknown compare constants is by Googling them or reading up on fundamentals. In this case the fundamentals concern how does an interrupt really work? The answer to this specific compare can either be guessed, based on how interrupts work and that the memory addresses referenced 4Ch is the IVT entry for the ‘int 13’ handler. The other way is the fact that DiskCryptor is open source and you can search the source for it, eventually finding out it is a check to know if ‘int 13’ has already been hooked.
The reason why the call is interesting is due to the fact that ideally you try to name all calls, at least that’s my normal approach when reversing regular executables. For this specific call you’ll notice that it has a couple of ‘int 13’ instructions. When you search for these you’ll learn that they usually deal with the disk and thus indicate some kind of code to read additional sectors.
The code block should trigger a sort of deja-vu, since this is very similar to the code we learned about in the previously linked blog post. This code relocates the current MBR to a different memory address and then continuous execution on the next instruction:

Which we can sort of confirm by placing the cursor at 0000:7c5a and disassemble it. It should result in code that makes sense:

If you are like me, you would have found the previous explanations difficult to follow along as well as understanding the assembly / decompiled C code with this type of static analysis. This is normally the point where I start to wonder if it is easier to just see the code work in a debugger? To perform debugging of boot code we will use QEMU and GDB.
Setting up QEMU and GDB
Even though I often make the mistake of using QEMU from the distro repositories, I’d recommend downloading and compiling the latest version. It is a pretty painless process and ensures you’ll get an up to date version to work with. Before running QEMU I first start the FUSE script ‘wrap_directory.py’ to print all read and writes and then I start emulation with the following command (beware of line breaks due to wordpress theme):
sudo ./qemu-system-i386 -snapshot -m 1024 -drive
file=~/github/public/boot_loader_reversing/mountpoint/dc-bios.img
-monitor stdio -s -S -object memory-backend-file,id=mem,size=1024M,
share=on,mem-path=/dev/shm/panda-mem -numa node,memdev=mem
This command ensure that we access the image through our fuse wrapper and also enables memory as an accessible file, in the event that we would need to run volatility, rekall or similar software. In addition it also enables remote GDB debugging and pauses the virtual machine at boot, until you connect GDB and instruct it to continue executing.
As for GDB I usually create a ‘dot_gdbinit’ file and then symlink the real ‘.gdbinit’ to it, my version can be found in the same github repository as mentioned in the beginning of this blog post. If you start using it now you might run into issues, since it also contains stuff that is explained later on. Normally I start by using the following commands in my ‘.gdbinit’ file:
set architecture i8086
target remote :1234
set disassembly-flavor intel
hbreak *0x7c00
continue
The first line attempts to force GDB into 16bit mode, for some reason this is really buggy / does not work / PEBCAK. I’ve tried issuing the command after connecting, but no go either :( this results in a bit messy disassembly which makes it more annoying to observe what is happening. The second line connects GDB to QEMU and the third line sets my preferred way to view assembly stuff. The fourth line is important since it ensure that a hardware break point is set at exactly the address that will be used to start executing our MBR code. The last line will then let QEMU continue with execution until the breakpoint is hit.
Debugging MBR with GDB
We can now inspect the code with GDB by stepping through the code with ‘ni’ or ‘si’ and using ‘hbreak’ extensively. However this becomes a tedious process specifically when we encounter interrupt calls which have their own parameter and calling convention. In addition we don’t want to manually single step all lines of assembly, we’d prefer to automatically break on specific instructions right? So to achieve the aforementioned challenges I’ve searched around and found (all found code is properly referenced) some nice example code which I’ve extended to make our life a bit easier. If we place the file ‘debug_cmds.py’ in the same directory as the one from which we launch GDB and update our ‘dot_gdbinit’ file with ‘source debug_cmds.py’ we now have access to the following commands:
- brm-ci <mnemonic>
- brm-disassemble [count]
- brm-pexi
The first command allows us to break on a specific instruction for example:
brm-ci int
This would run the MBR code until the interrupt instruction is encountered. The brm-disassemble command allows us to disassemble the code. Why build my own disassemble command? Well because in real mode you have to account for memory segments. Which means that instead of doing:
disassemble $pc,+100
You have to do:
disassemble $cs*16+$pc,+100
To avoid having to type that, i use the other implemented command and it thought me a bit more about GDB and python scripting as well. The last command ‘brm-pexi’ is the most interesting one, since this is my attempt at implementing some interrupt parameter parsing and making it easier to understand what is going on. It is work in progress, so feel free to submit a pull request to extend it with support for more interrupt calls. Here is an example debugging session using these new commands:
(gdb) brm-disassemble
0x00007c00    xor    eax,eax
0x00007c02    nop
0x00007c03    nop
0x00007c04    jmp    0x7c16
(gdb) brm-ci int
0x00007c02 in ?? ()
0x00007c03 in ?? ()
[..]
0x00007d03 in ?? ()
0x00007d06 in ?? ()
int    0x13
(gdb) brm-pexi
called 0x13 - low level disk services
Function 0x41 - Test Whether Extensions Are Available
Function params:
    DL (drive index) 0x80
    BX (signature) 0x55aa
0x0000d445 in ?? ()
Return values
    CF (clear if present) 0
    AH (error|version) 0x41
    BX (signature) 0x55aa
    CX (supported iface) 0
Much better right? We jump through the code in an easier way and the interrupt calls are automatically decoded.
The brm-pexi command contains a bug in which it does not really execute the interrupt call. Since I’m having some issues with the whole GDB / QEMU setup I’ve left it like this. It reminds me of what the correct registers and their values should be upon return. Since the scripts are mostly POC and a learning point for myself I might fix it in the future.
While developing this I also encountered a fun trick with GDB where you can load structure definitions into GDB even when you don’t have source code. This is the point where the instructions from the readme of my github repo are followed and our ‘dot_gdbinit’ is now complete:
set confirm off
add-symbol-file dap-main.o 0
set confirm on
We can see the usefulness of this when we encounter an interrupt call to actually read sectors from the disk:
(gdb) brm-pexi
called 0x13 - low level disk services
Function 0x42 - Extended Read Sectors From Drive
Function params:
    DL (drive index) 0x80
    DS:SI (DAP) 0x0:0x7c06
Print DAP structure using:
    set $dapstruct = *(struct dap *) ($ds*0x10+$si)
    p/x $dapstruct
Print dap buffer (after executing interrupt) using:
    x/10x $dapstruct.buffer_segment*0x10+$dapstruct.buffer_offset
By having the structure definition loaded into GDB we can now see what will be read by the MBR code:
(gdb) set $dapstruct = *(struct dap *) ($ds*0x10+$si)
(gdb) p/x $dapstruct
$1 = {size = 0x10, unused = 0x0, numsectors = 0x27, buffer_offset = 0x0,
buffer_segment = 0x2000, startsectors = 0x27fffd1}
In the above output we can see the buffer into which the sector data will be read, the sector offset and the amount of sectors that will be read. If we continue to execute over the interrupt we can then print the buffer data:
(gdb) x/10x $dapstruct.buffer_segment*0x10+$dapstruct.buffer_offset
0x20000:    0x90909090  0x8ec88cfa  0x31e88ed8  0x8ec38edb
0x20010:    0xbcd38ee3  0x52fb4000  0x5d0000e8  0x8de5c583
0x20020:    0x6609ff9e  0x66085f8b
If we want to make a copy of this second stage code that is executed by DiskCryptor we can do this by using dd:
dd if=~/disk-images/dc-bios.img of=dc-bootsector2.img bs=512 skip=41942993 count=39
Seems like it is time for Ghidra again, to at least obtain a general understanding before we dive into debug mode again. We can load the file just like we did the original MBR, main difference is that the base address will now be set to 2000:0000 which is a value we learned from the dapstruct output as well as some further debugging.
Second stage analysis
When we load the second stage in Ghidra and disassemble at the first line we should see the following:

We can immediately observe that code will be copied to another place and jumped to it, since we recognise the same constructs, namely a repeated mov and the segment and offset pushes just before the return (which should be a far jump due to the whole segment addressing stuff afaik). A clearer view of the pushed offsets can be obtained if you look at the decompiled code in Ghidra.
However a lot more stuff is going on before the copy of code to another memory location, which for now we will ignore. This is of course personal preference, I usually prefer to get the big picture first, before diving into details. If you want to dive into details you can sort of see that a structure of some sort is being used, wondering how? Due to the LEA BX, [BP + 0x9ff] which loads an address into BX and then addresses offsets relative to BX. Also if you go to offset 0x9ff you’ll see ”MBCDE#” which could be some kind of header. Under normal circumstance you’d spend a couple of hours or days (depending on your RE knowledge) on deciphering what the structure is and what the structure members are used for.
To see the code that is being copied in Ghidra I made my life easier and used GDB. I placed a breakpoint @ 2000:005b, except that in GDB we do it like this (2000h*10h+5b): hbreak *0x2005b ideally resulting in the following:
(gdb) brm-disassemble 5
0x0002005b    rep movs BYTE PTR es:[edi],BYTE PTR ds:[esi]
0x0002005d    pop    edx
0x0002005e    lea    eax,[esi+0x67]
0x00020061    push   eax
0x00020062    push   es
(gdb) i r
eax            0x2000   8192
ecx            0x931    2353
edx            0x9880   39040
ebx            0x1d 29
esp            0x3ffe   0x3ffe
ebp            0x0  0x0
esi            0xce 206
edi            0x0  0
eip            0x5b 0x5b
eflags         0x246    [ IOPL=0 IF ZF PF ]
cs             0x2000   8192
ss             0x0  0
ds             0x2000   8192
es             0x9880   39040
fs             0x0  0
gs             0x2000   8192
Which means that the offset from which the code will be copied is 2000:00ce and the size is 0x931, since that is what the CX register was set to. However the jump is not to the start of the copied code, if you look at the pushes and verify it with GDB, it jumps to 0x69f. If we want to view this code in Ghidra we have to actually go to offset 0xce + 0x69f thus we need to decompile at offset 2000:076d presenting us with the following:
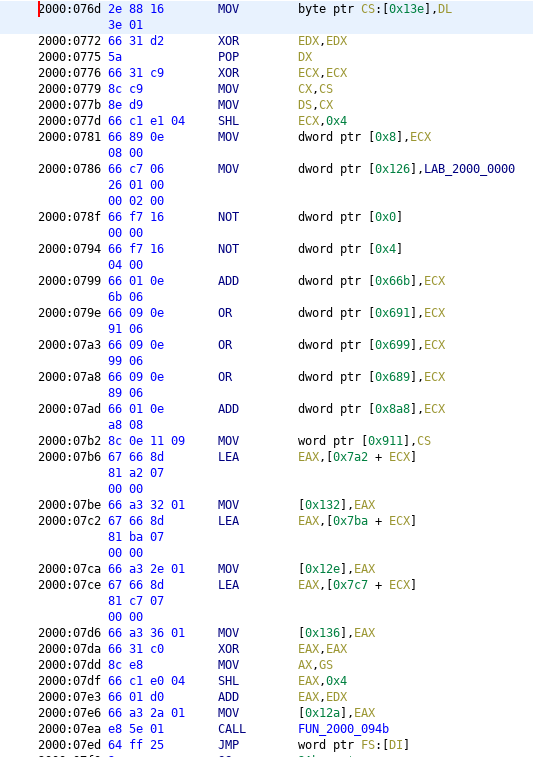
Again we see a lot of mumbo jumbo, however it also contains a call, so let’s look into that first.
Since I’m still learning a lot whenever i try to do some reverse engineering, I’ve learned that combining dynamic with static analysis speeds up my process a lot and it helps me to perform better analysis of static code. The most likely reason probably being that it ‘just clicks’ better in my brain when I see the code doing what it is supposed to do in a debugger.

This functions caught my attention, due to two things the instruction ‘LQDT’ and the instruction ‘JMPF’. If you’ve done your homework regarding real mode, you know that eventually you have to jump into protected mode if you want to boot the actual operating system. So first things, first what if we just google the following snippet:
MOV EAX,CR0 OR EAX,0x1 MOV CR0,EAX
Bingo, the first page contains all kind of results related to jump into and out of protected mode. If we expand our search we hit the wonderful pages of osdev.org:
With even more good news, the pages contain example code! From this point onwards you can identify code that jumps into protected mode and back and start to follow the code and focus on important parts. Now all that is left to do is to spend a lot of time in reversing the rest of the second stage boot loader to fully understand how it works. Since DriveCrypt is open source I’d encourage that you try it while you keep an eye on the source to grasp all the details and get familiar with the code constructs.
You will probably also notice that the boot code consists of more than just assembly, making it a bit more readable. The only way to learn reversing is by doing it after all :)
Conclusion
Real mode is still a PITA to do stuff with, but there is enough tooling to enable research. In addition there is still a lot of code that runs in real mode, thus providing ample opportunity for research, even though secure boot is finally starting to get noticed. As usual it was a lot of fun to deep dive into some of the more obscure parts of computers, the only downside is the fact that the deeper you go the scarcer the information gets…or maybe it’s just my google fu ;)
References
A lot of the references can also be found in the readme
- DriveCrypt boot code
- Books
- The Rootkit ARSENAL
- Rootkits and Bootkits
- Articles

I don’t fully understand the question, but the reads are the data that is being read by Windows when it boots. So if you use that data the next time it would be able to boot. It could still happen that Windows on each boot might need data from a different offset, that might have not been recorded previously. The goal of this partial image script is mostly to grab small amounts of data that you can then use to attack boot enmcryption or other mechanisms.
What you write is very interesting, and I want to understand the emulate_partial.py, I have a 320G hard disk with windows 7 SP1, x86, it is not encrypted, since I want to see how the emulate_partial.py file works.
First, run fdisk -l and it sends me this:
Device Boot Start End Blocks Id System
/dev/sdb1 * 2048 206847 204800 100M 7 HPFS/NTFS/exFAT
/dev/sdb2 206848 625139711 624932864 298G 7 HPFS/NTFS/exFAT
Next, I run the file called emulate_partial.py in python:
$python emulate_partial.py /media/evil/hardisk0 /home/evil/tmp
When I enter the tmp folder, the emulate_partial.py sends me this:
r / bootmgr 0 32768
r / bootmgr 0 32768
r / Boot / BCD 0 24576
r /Boot/BCD.LOG1 0 4096
r /Boot/BCD.LOG2 0 4096
r /Boot/BOOTSTAT.DAT 0 32768
r / Boot / BCD 0 24576
r /Boot/BCD.LOG1 0 4096
r /Boot/BCD.LOG2 0 4096
r /Boot/BOOTSTAT.DAT 0 32768
But, if I enter the windows boot folder, it sends me this:
r / Boot / BCD 0 24576
r /Boot/BCD.LOG1 0 4096
r /Boot/BCD.LOG2 0 4096
r /Boot/BOOTSTAT.DAT 0 32768
r /Boot/cs-CZ/bootmgr.exe.mui 0 32768
r /Boot/da-DK/bootmgr.exe.mui 0 32768
r /Boot/de-DE/bootmgr.exe.mui 0 32768
r /Boot/el-GR/bootmgr.exe.mui 0 32768
r /Boot/en-US/bootmgr.exe.mui 0 32768
r /Boot/es-ES/bootmgr.exe.mui 0 32768
r /Boot/es-ES/memtest.exe.mui 0 32768
r /Boot/fi-FI/bootmgr.exe.mui 0 32768
r /Boot/fr-FR/bootmgr.exe.mui 0 32768
r /Boot/hu-HU/bootmgr.exe.mui 0 32768
r /Boot/it-IT/bootmgr.exe.mui 0 32768
r /Boot/ja-JP/bootmgr.exe.mui 0 32768
r /Boot/ko-KR/bootmgr.exe.mui 0 32768
r /Boot/nb-NO/bootmgr.exe.mui 0 32768
r /Boot/nl-NL/bootmgr.exe.mui 0 32768
r /Boot/pl-PL/bootmgr.exe.mui 0 32768
r /Boot/pt-BR/bootmgr.exe.mui 0 32768
r /Boot/pt-PT/bootmgr.exe.mui 0 32768
r /Boot/ru-RU/bootmgr.exe.mui 0 32768
r /Boot/sv-SE/bootmgr.exe.mui 0 32768
r /Boot/tr-TR/bootmgr.exe.mui 0 32768
r /Boot/zh-CN/bootmgr.exe.mui 0 32768
r /Boot/zh-HK/bootmgr.exe.mui 0 32768
r /Boot/zh-TW/bootmgr.exe.mui 0 32768
r /Boot/cs-CZ/bootmgr.exe.mui 0 32768
I know that it is a partial copy, and here my doubt enters:
How can I know if my partial copy is left to start windows? According to me, you can correct me, I would already have the partial copy, as long as I investigate file by file that the emulate_partial.py sends me, until it is automatically linked to the partition where Windows is complete. I’m fine? or would I miss something?
I work on an i5 machine, with 64bit ubuntu.
Hi,
The emulate_partial.py script is intended to capture disk i/o from a process reading from a file. So this script cannot be used to make a disk image from a normal disk. It takes two directories as arguments. You then provide the mount point to the process and when it starts reading from the mount point the data is captured and stored to enable emulation later.
From your output it seems like you are pointing it directly to the disk. Try the /dev/ directory instead. Also be aware that I’m guessing that if you try this with the entire /dev/ directory stuff might fail, since this was mostly intended as a POC script to capture the read data from the early boot stages.
I would also recommend to never test stuff directly on /dev/sdb* directly, but first create a full dd image. Otherwise you risk losing your data in a worst case scenario.
Good morning, I have not been able to run the emulate_partial.py script, probe mounting with mount / dev / sdb1 / mnt / disk, and when I run the script it sends me the error fuse: mountpoint is not empty, fuse: if you are sure this is safe, use the ‘nonempty’ mount option. I dismantle.
I have tried sudo mount.fuse / dev / sdb1 / mnt / disk and it sends me error of / bin / sh: 1: / dev / sdb1: Permission denied
If you could guide me so that I can execute the script correctly? I hope you have a chance to help me.
In the era of self encrypting disks, other solutions are useless and way less secure.