Sometimes you are asked to perform a firewall analysis to determine if the configuration can be improved upon to reduce the ability for an attacker to move laterally through the network or identify attack paths that have been missed due to the many firewall changes.
You can perform this analysis using many tools and approaches, ranging from manually reviewing every rule, to using an automated tool like nipper or my personal favourite using a graph based approach (also works for log data). The reference section of this post contains papers that go in-depth on this approach.
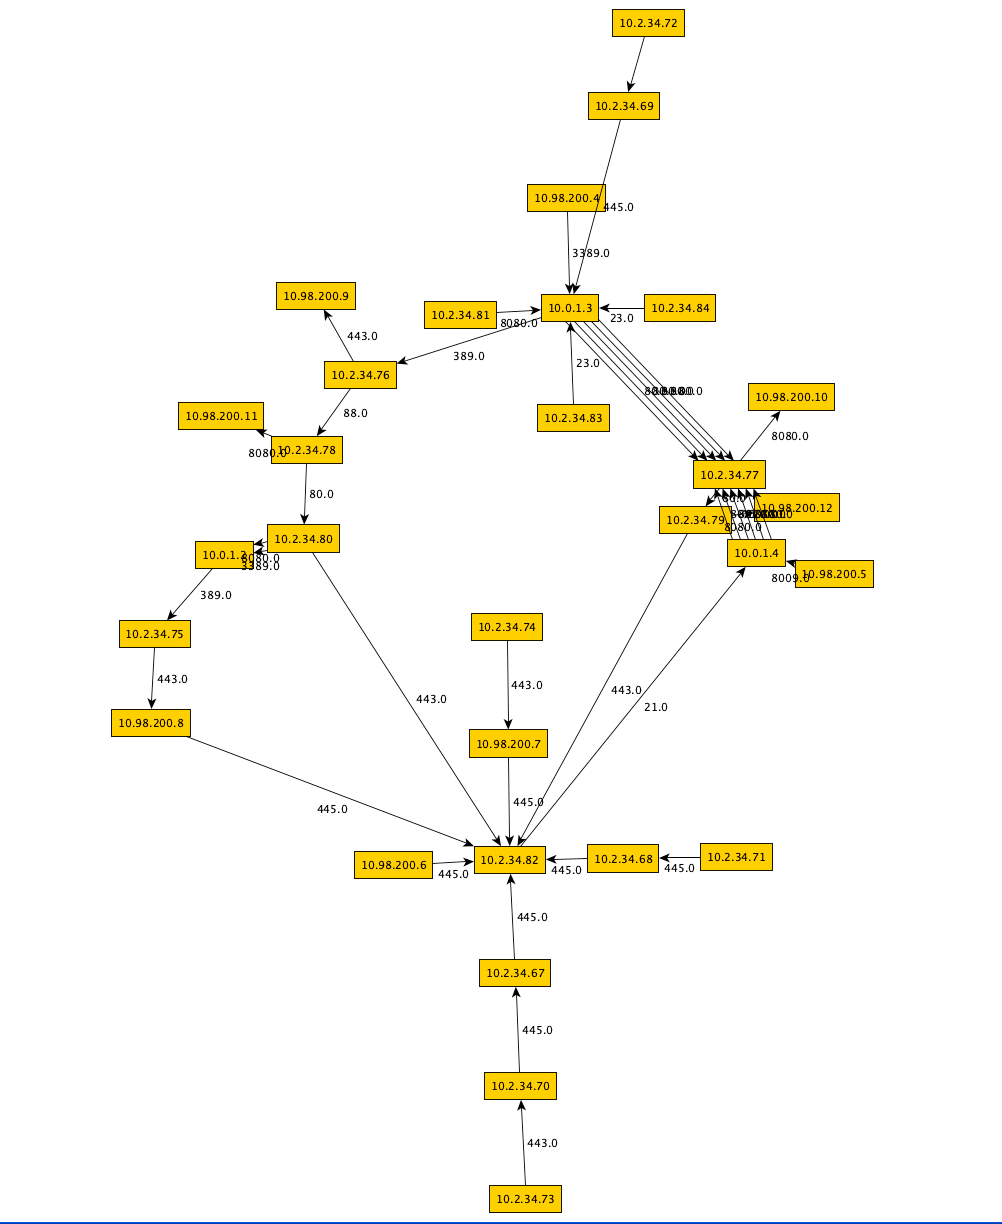
With the graph based approach you can visualize the ruleset to identify nodes that have a lot of incoming and/or outgoing connections, but you can also trace paths through the network to understand if they should be removed. When combined with bloodhound data and neo4j you can query the data and have the graph database answer questions like “Is there a path from the workstation to the finance server?”. This requires some fair amount of knowledge, as well as supporting software to get it all setup, which in turn complicates the transfer of knowledge to network engineer or firewall administrators to be able to perform these analysis themselves, for the sake of better understanding if their changes impacted the security of the network.
Bottom line for me with these type of analysis is: How can I transfer security knowledge in an easy and understandable manner, to the people that have to deal with maintaining the environment on a daily basis?
Continue reading “Firewall analysis: A portable graph based approach”