This blog post is intended to further practice with MITRE data as well as understand some OT attack techniques implemented by OT malware. For this we are going to look at Pipedream (researched by Dragos) and Incontroller (researched by Mandiant), no these are not two different malware strains, but the same. It just happened to be a coincidence that they researched the same malware strain and named it differently or so I assume.
I chose OT malware because I was curious, but it could have just been your run of the mill other type of malware. When malware or attacks hits the news a lot of people want to know what it is? who is behind it? what to do against it? wanting to know if they would be resilient against it? and many more questions of a similar sentiment. These questions can be answered in a variety of ways, but I thought, let me answer them by using the MITRE data. You can read about my first baby steps into workin with MITRE data in the previous blog about MITRE, Stix, Pandas, etc.
In this blog post we will dig deeper to actually attempt to answer some of those questions and figure out, if we’d have to deal with this malware, what actions could or should we take to be resilient?
Oh and as usual you can skip to the jupyter notebook here if you prefer a more hands-on approach and less reading.
Overview of Pipedream / Incontroller
Pipedream or Incontroller is a framework that enables a threat actor to attack OT environments. According to Dragos & Mandiant the framework is highly flexible and demonstrates that the attackers know what they are doing. The framework consists of the following modules:
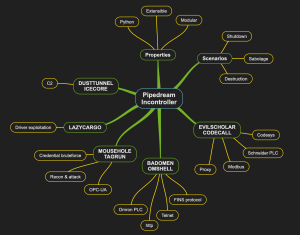
DUSTTUNNEL / ICECORE
A custom implant with capability to perform host reconnaissance and command-and- control activities.

MOUSEHOLE / TAGRUN
A tool that scans for OPC servers, enumerates OPC structure/tags, brute forces credentials, and reads/writes OPC tag values.

BADOMEN / OMSHELL
A framework with capabilities to interact with and scan some types of Omron PLCs via HTTP, Telnet, and Omron FINS protocol. The tool can also interact with Omron's servo drives, which use feedback control to deliver energy to motors for precision motion control.

EVILSCHOLAR / CODECALL
A framework that communicates using Modbus—one of the most common industrial protocols—and Codesys. It contains modules to interact with, scan, and attack at least three Schneider Electric programmable logic controllers (PLCs).

LAZYCARGO / -
A tool that drops and exploits a vulnerable ASRock driver to load an unsigned driver.
The following visual image provides an overview of the capabilities, which might be easier to understand than a couple of paragraphs of reading:
One of the interesting aspects (at least for me) is the wide range of capabilities that it has in attacking a network with OT components. Even more interesting if we look into the mapping of Pipedream/Incontroller onto the default Purdue Enterprise Reference Architecture (PERA) model as presented by both companies that investigated this, first image being Dragos, second Mandiant:
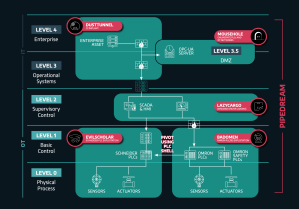

So basically this framework seems to be sufficient to go from an initial foothold on a machine in the IT part of the network all the way to the full compromise of the PLCs on the OT part of the network. Let’s dive into analysing this based on MITRE and see if we can determine what to do if we want to be resilient.
Our questions
To be fair, I don’t really have any questions since I just wanted to further play with Jupyter, MITRE, STIX, etc. Since we want to play with the data it is useful to keep in mind what type of questions we’d be trying to answer. The following is what you might hear when novel malware or attacks hit the news within some companies:
- Are we safe against this new threat X?
- Should we do something against this new threat X?
- Could we be affected by threat X and not know it?
Let’s think, what type of information would we need to be able to somewhat answer those questions? My initial reaction would be, something along the lines of:
- What does threat X do?
- Which security controls are effective against what threat X does?
- What do we currently have in place?
- Can we detect threat X?
That seems like something that we can work with right? Most of that information should be available within MITRE, but not all of the information since it seems that the samples for the OT part of this OT attack framework are not public.
Also, the mandatory warning before I forget: MITRE is not a silver bullet, there could be relevant information which is not captured in the framework. Be aware of this when working with MITRE. In addition, I’ve not properly cleaned all data or chased all avenues, since I’m mostly interested in the approach.
Our answers
So let’s answer some questions by querying the MITRE data. Just like the previous blog post we will be using the MITRE data in STIX format and limit ourselves only to this data.
What does it do?
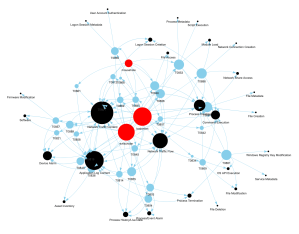
For this question the work has already been done for us with the published reports and information on this framework. We can simply use the described MITRE techniques numbers and names. This provides us a solid starting point to understand the capabilities. Keep in mind however that it does not provide the full picture, and reading the published reports is essential to grasp the bigger picture as well as the relevant context. Since we kept track of which technique is used by which modules, we can visualize if there are techniques that are used by more than one module:
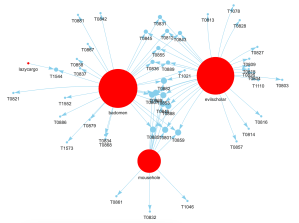
This could of course also be obtained from a table view, however in a graph view I think it is much clearer that there are some clusters of techniques shared by multiple pipedream modules. The nodes are scaled to the amount of connections. This tells us a bit which malware node connects with the largest amount of techniques, however to have a better understanding we could further extend this with the assets targeted by the techniques:

The above picture seems less useful at first sight due to the density of the graph. If we explore the graph it would help us understand which techniques targets the greatest amount of assets or the most critical assets. This would potentially allow us to understand which paths are useful to focus on. To fully answer if this is relevant to our theoretical company we DO require a proper asset overview, to understand which of those targets are available within our company.
This should of course not be the only data point to make decisions, but the approach where we try to underpin at least part of the decision with reproducible data is interesting. Since this will allow us later on to learn from bias in the data or mistakes made or just benefit from improvement of the data over time.
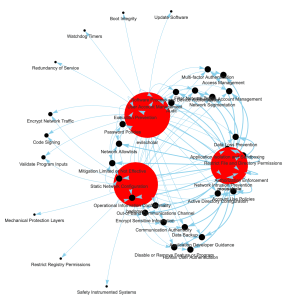
Which security controls are relevant?
When graphing this, we can again appreciate the density of the graph:

We can explore these nodes to understand which security controls would apply to most of the techniques. Again this could be easily answered with a table view and doesn’t necessarily need a graph, but it does help to play around and become familiar with STIX and MITRE if you prefer visualizations.
We can also visualize this in a more direct manner between the malware and the mitigations, which looks like this:
This is less dense and it offers us a nice clustered view. However, we loose the granularity that we had with techniques. By having techniques we can generalize to other new threats, which we can’t easily do if we just keep track of a more direct relationship between malware and mitigations.
Do we have logging for its actions?
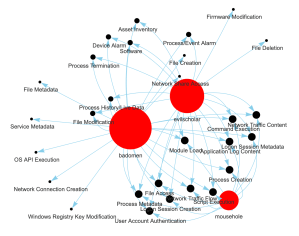
When graphing this, we can see that we are probably missing information (specially since we drop multiple rows), on the plus side it looks less dense:
In this image we can see some big datasource nodes, which can be used as a guidance to understand if we have those configured. We could also visualize the link between the malware and the datasources directly, but that changes the visualization completely:
Conclusion
With this small exploration of the data if we would have had a real company with an OT environment, we would have been able to answer part of the questions. The devil is in the details however, because we haven’t really answered the questions, there is still some uncertainty that remains. For example, the dataset that we used is not complete, the information on the malware is not complete. This should not distract us from at least answering part of these questions based on a data driven approach, instead of just gut-feeling.
One of the insights when visualizing the data in different manner is the fact that having techniques provides a better view than just directly mapping the malware onto mitigations or datasources. Techniques are re-usable in that sence and make it much easier to determine if you have to panick when a new malware sample appears or not panick because your detection sources and mitigations already cover part of the behaviour.
References
- Blogs
- https://github.com/mitre-attack/attack-stix-data/blob/master/USAGE.md
- https://www.incibe-cert.es/blog/incontroller-amenaza-inteligente
- https://www.dragos.com/blog/industry-news/chernovite-pipedream-malware-targeting-industrial-control-systems/
- https://www.mandiant.com/resources/blog/incontroller-state-sponsored-ics-tool
- Videos
- Malware

One thought on “Analyzing Pipedream / Incontroller with MITRE/STIX”