So there I was preparing a presentation with some pretty pictures and then I thought…after I give this presentation: How will the audience play with the data and see for themselves how these pictures were brought into existence?
Finally I had a nice use-case to play around with some kind of environment to rapidly prototype data visualization in a manner that allows for repeatable further exploration and analyses, hopefully with the ability to draw some kind of conclusion. For now I settled to just learn the basics and get used to all these nifty tools that really make these types of jobs a breeze. You can skip this post and directly go the jupyter notebook if you just want to dive into the data/visualizations. The rest of the blog post is about the choices made and technologies used, mostly intended as a future reference for myself.
The specific use-case that I wanted to talk a little bit about is why data matters and how it can be used to gain more insights into techniques, mitigations, detections etc. Even if the mitigations and detections to implement are pretty well known and often advised, it helps to understand why they are so prevelant in many consultancy/pentest/red team/incident response reports, it lowers the gut feeling percentage of what we as a cyber security industry do. Just so you know, these type of initiatives (data driven insights) are pretty awesome in that regard (even if the data is still a bit flawed): https://controlcompass.github.io/
Anyhow, back to my main quest Jupyter, how to install / run it? Google Colab to the rescue. Like I said, I wanted to mainly find a nice solution to rapidly prototype ideas and if there is something that always slows that process down it is the darn setup & configuration of an appropiate environment. After the prototyping you can always package it all in a nice docker container for offline consumption, like this example suricata analytics by Stamus.
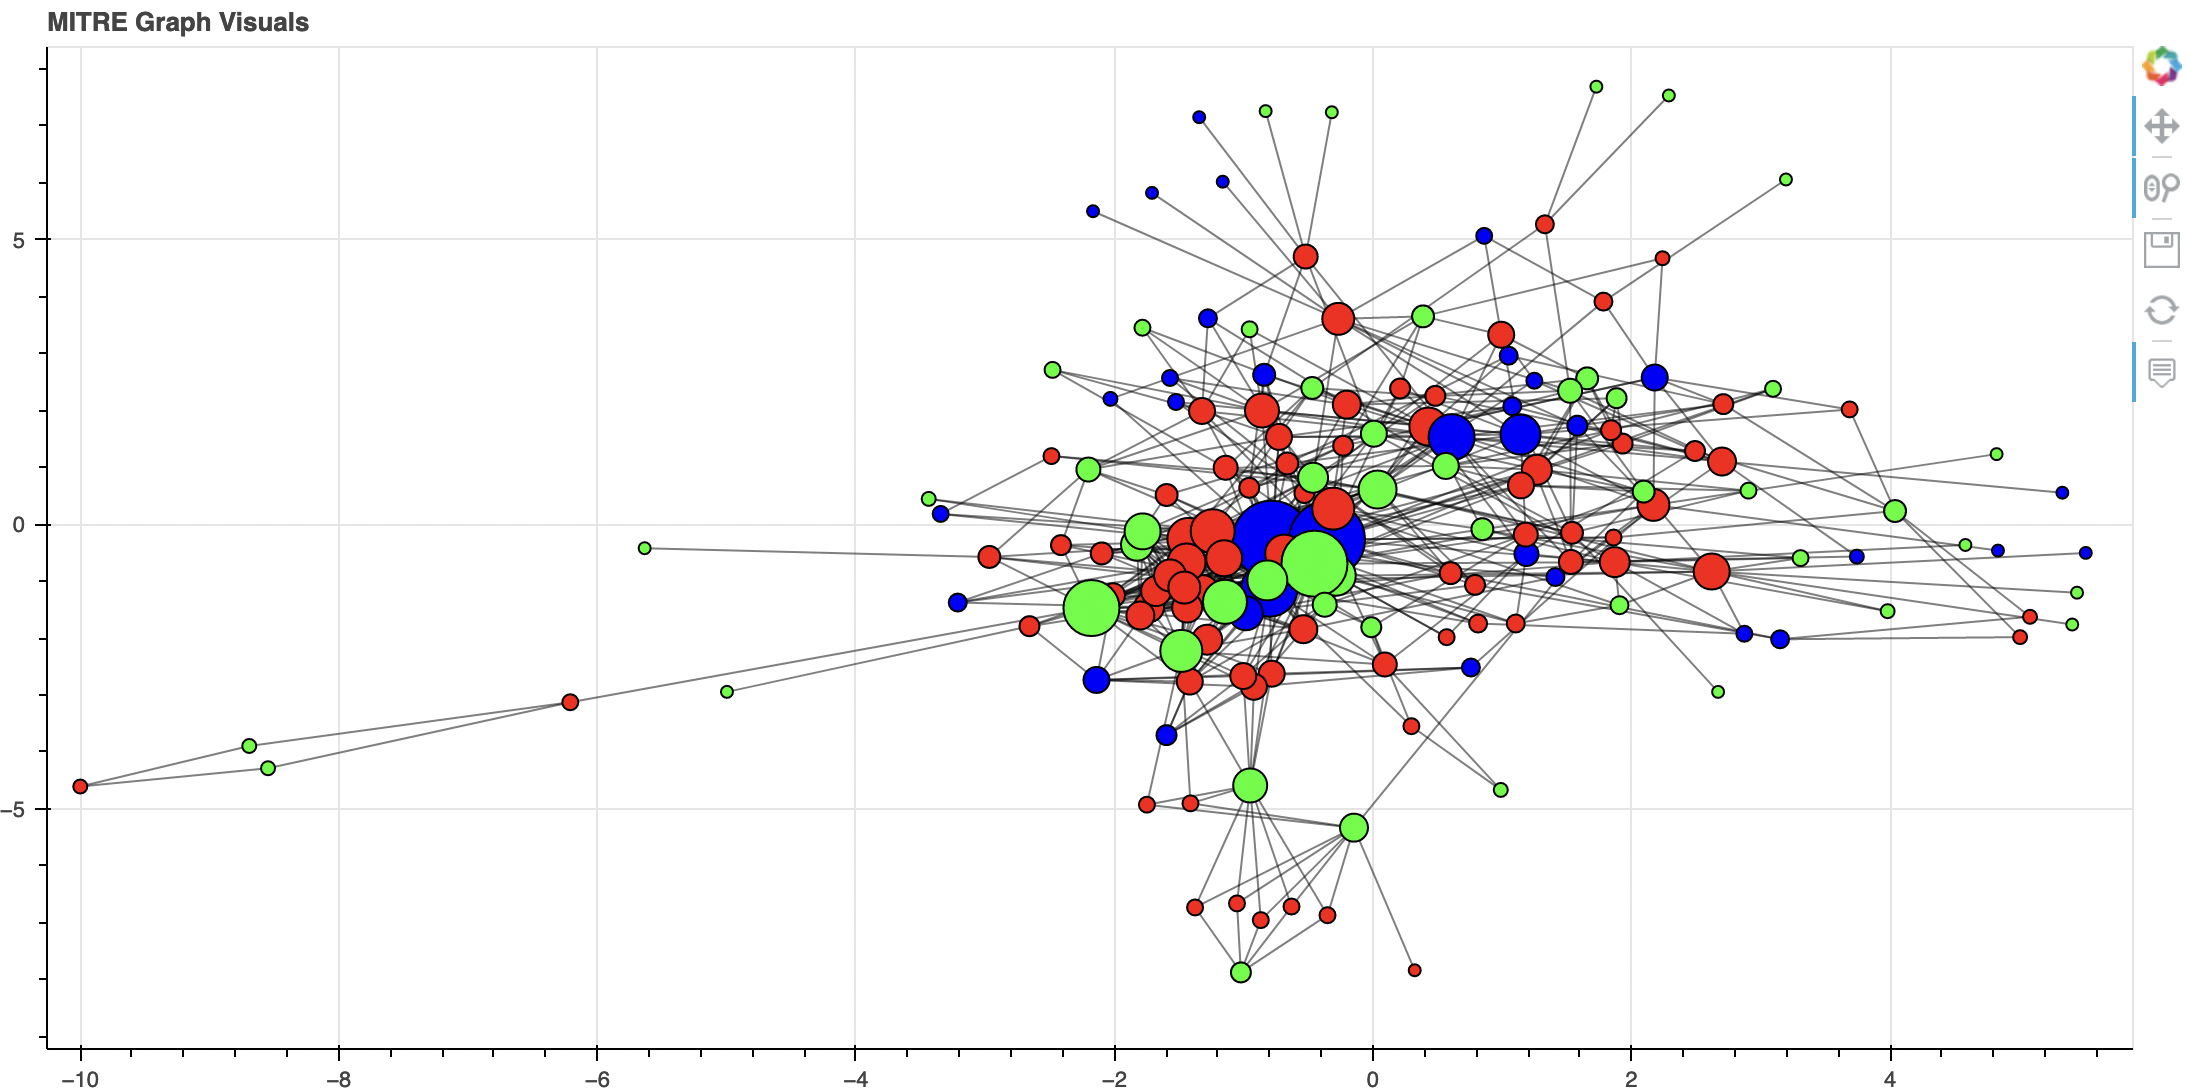
What about MITRE, how will we get the data that we need to visualize it? One option is to use the very nice attack cti library. However, for this part I wanted to really dive into the nitty gritty details, so I decided to interact directly with the Stix/Taxii servers that MITRE has available. One of the better resources to grasp the concept of MITRE & Stix was the repository attack-stix-data.
Now we have a Jupyter notebook and Taxii servers available holding all the data, but how can we work with the data when we obtain it? This is when I found this excellent resource from Melanie Walsh. You guessed it correctly, this is where Pandas as well as Bokeh & NetworkX came into play. Most of the code is from her book/online tutorial. Here is what I learned about the components:
Pandas – They really are nice to have data in a manner to allows for easy access, filtering and general messing around.Bokeh – I’ve always hated front-end stuff, but this library and the alternative HoloViews are really a breeze to work with. You can actually focus on what you want to achieve, instead of also having to worry about things like zooming, panning etc. Bokeh, still has some bugs though like for example it seems to be a known bug to not be able to drag circles in a graph :( or maybe it’s just my lack of knowledge.NetworkX – I always thought you had to work with graph databases to be able to do meaningul graph operations, but nothing is further from the truth. If you have a manageable dataset, networkx is pretty sweet to quickly wip some data into a graph and explore it.
A more general lesson learned is: You can’t meaningfully visualize data if you don’t know what you want.
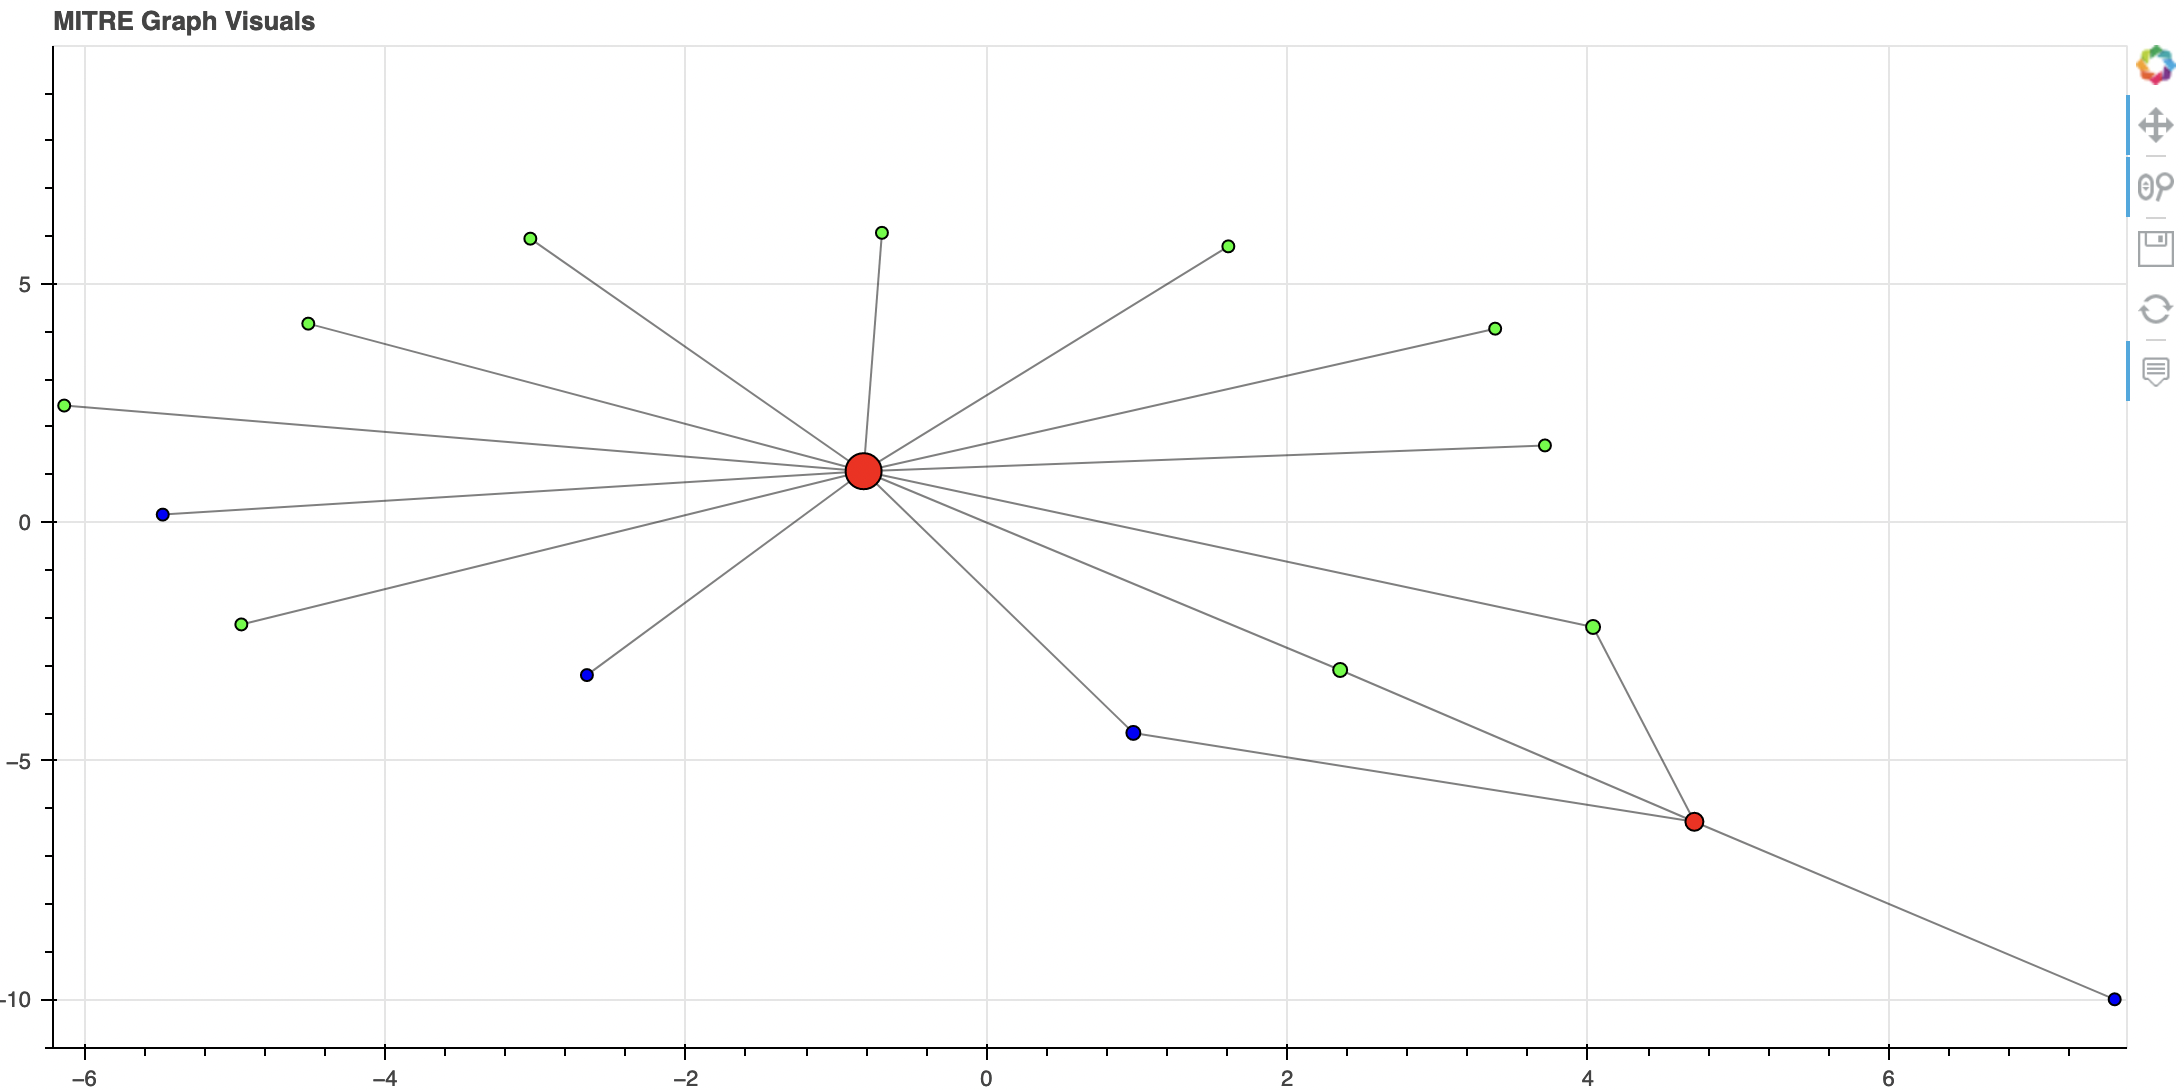
When you have everything in place it becomes pretty easy to for example zoom in on just a couple of techniques, case in point: this is how it looks like when we only select the techniques (red) Default Credentials and Valid Accounts to graph their relation to mitigation (green) and detection data components (blue):
Just a final heads-up, make sure you clear the output of your Jupyter notebook when you share them, otherwise everyone can see your data ;)

2 thoughts on “Baby steps into MITRE Stix/Taxii, Pandas, Graphs & Jupyter notebooks”