In the previous blog post you could read about my experiment with using Microsoft Application Inspector as a tool to:
-
- Scan a code base
- Identify technology components
- Visualize & determine risk
What we learned was that using a pretty coarse tool to establish a guesstimate of risk seems to be doable. We also learned that the output format lends itself very well to transfer knowledge about a code base.
But, how do we go from “seems doable” to “I’ve got a transferrable guesstimate on code risk”? My first idea was to just continue with merging the previous kibana visualizations into a nice interactive one and be done.
After some playing around I noticed that it wasn’t that easy! Further experimentation revealed, that the main reason I was struggling to visualize risk is the fact that I had no clue what I really meant by ‘code risk’. Sure, I know how to spot vulnerabilities in code and reason about it, but is that really a risk? I asked other pentesters and it was interesting that finding the vuln was easy, defining the risk was not. For example, a code base with clearly observable vulnerabilities is often viewed as a risk. What if those vulnerabilities are fixed, just enough, do we then still consider that the risk is present? If you are wondering what ‘just enough’ means, here is an example:
Vulnerability: SQL injection in ID parameter of an URL
Root cause: Untrusted user input used in a non-parametrized SQL query
Fix: Regex to only allow numbers
So, would this after implementing the fix: a) Be a vulnerability? b) Could we consider this a risk? I think that at the very least the query should also be rewritten to be parametrized. Why do we still hammer on changing the code if the vulnerability has been fixed? Because, speaking for myself, the used function or implementation of the functionality is flawed by design. So even if the exploitable vulnerability has been fixed, I still consider this risky code.
Yes, you could argue that it is the use of the function and not the function itself that carries the risk. For this blog and the purpose of this experiment, I’m not going to dive into those semantics.
For now, let’s dive a bit deeper into understanding risk then defining risk and hopefully visualizing risk in an interactive manner. The transferrable aspect is, of course, the fact that the knowledge is bundled into easy and structured file formats. The github for the POC files can be found here.
Understanding code risk
Let’s visualize this way of thinking, that resulted in me still thinking that there is a risk present in the codebase:
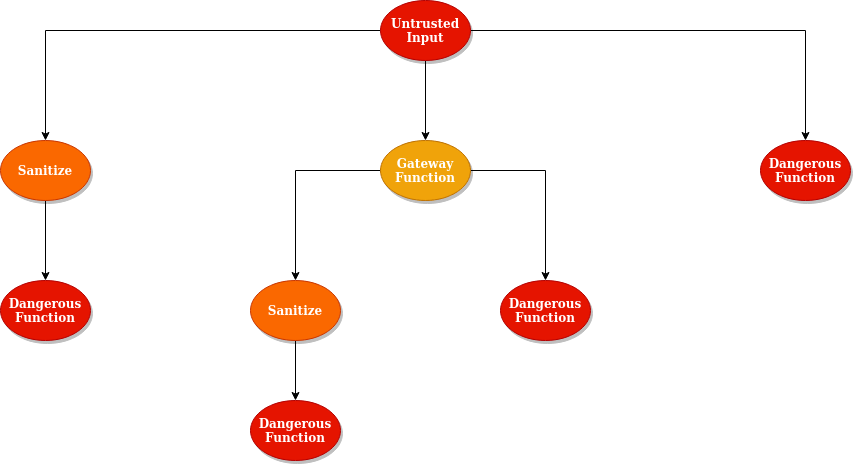
So what do we see in the above diagram? We see the way I think about risk when looking at a codebase purely from a function level perspective. I start with user input and determine what happens to it all the way until it reaches a dangerous function. The color scale indicates how much risk I think each item has, red being the highest risk. So based on this it seems that what I really care about is the use of dangerous functions. I didn’t even consider drawing safe functions with untrusted input.
For me the above exercise made me understand my own reasoning about risk a bit better. It’s just not the only perspective that I take into account when looking at a codebase. I also look at a codebase from a bit more abstract perspective than just the functions:
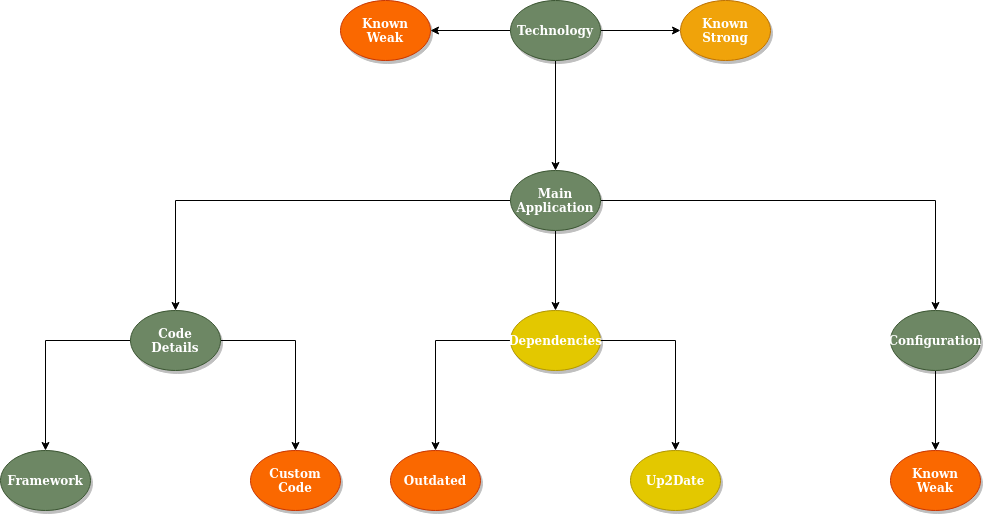
In the above image we see that when I wonder about vulnerabilities in an application, my first thought is about the technology or technologies that have been used to create it. Some are well known for improper (ab)use and inherent vulnerabilities. Others, while they still might contain vulnerabilities, contain much less risky functions due to for example secure by design type of implementation.
After that, I wonder about code details, dependencies, and configuration. Dependencies being the first one that worries me. Mostly due to the fact that it is well known that keeping all components of a codebase up to date is pretty darn difficult!
The worries about the code details are mostly about how much custom code has been used? How much of the application deviates from using an established framework for example? After that, my mind just shifts into function level questions.
As for the configuration, that’s pretty specific, it’s wondering which of the configuration options introduce specific vulnerabilities or contain inherent risk. For example, using a high privileged user for all operations.
There are many more components of course, but I think that this provides a nice overview of how I apparently define risk. Question is, will this help in visualizing a codebase in terms of a ‘risk guesstimate’?
Defining code risk
The interesting part about defining something is that usually you instantly disagree. There is always one corner case of sometimes even fundamental data missing. This will be no different, especially since I’m trying to just obtain a guesstimate and not obtain a fully functional and accurate-static-analysis-formal-verification type of result. I do hope however that it can help others to build upon it or even contradict it with better data. The only way to go forward is by trying, failing, learning & improving.
If we stop and think about the thought process, we could pick the elements that carry risk:
- Use of known weak technology
- Use of outdated dependencies
- Existence of custom code
- Known weak configuration
- Use of dangerous functions
Would this be a good definition of code risk? Of course not! However, I think it can be a good enough definition to attempt and visualize a code risk guesstimate. There are some other factors that I as a pentester consider when dealing with the above components:
- Do components contain known vulnerabilities?
- How often is ‘bad stuff’ used, sparingly or continuously?
- Is the ‘bad stuff’ scattered or concentrated?
Why do I think that if we combine the above definitions that we would then obtain a guesstimate on risk? I’ve reasoned about it like this:
If we know the frequency of how often those components appear, we guesstimate the amount of code that is potentially insecure.
If we know if custom code is used and if dangerous functions are used, we guesstimate where the risk could reside. If we interview the developers we know if this was inherited or developed, thus potentially guesstimating knowledge on secure coding.
If we know the spread of risk, we can guesstimate the chance of it being reached.
I could go on with some more examples, but I hope that the reasoning is clear with the above examples. Of course, all of this will lead to a guesstimate, but hopefully enough of a guesstimate to tell us:
- Which estimated % of the code is risky?
- Should we perform a manual code review?
- Where should we start manually reviewing?
And as previously stated all of this without a continuous need for a security expert. Yes, this is tricky, but if this enables companies to perform more code reviews in an early stage it is worth it. Even more so, if that code review knowledge flows back into the calculation of the guesstimate.
Attempt 1: Interactively visualizing risk
Now that we have defined risk for our little experiment, let’s attempt the first visualization. Just as a reminder, this is our definition:
The occurrence of the following items in a codebase:
- Use of known weak technology
- Use of outdated dependencies
- Existence of custom code
- Known weak configuration
- Use of dangerous functions
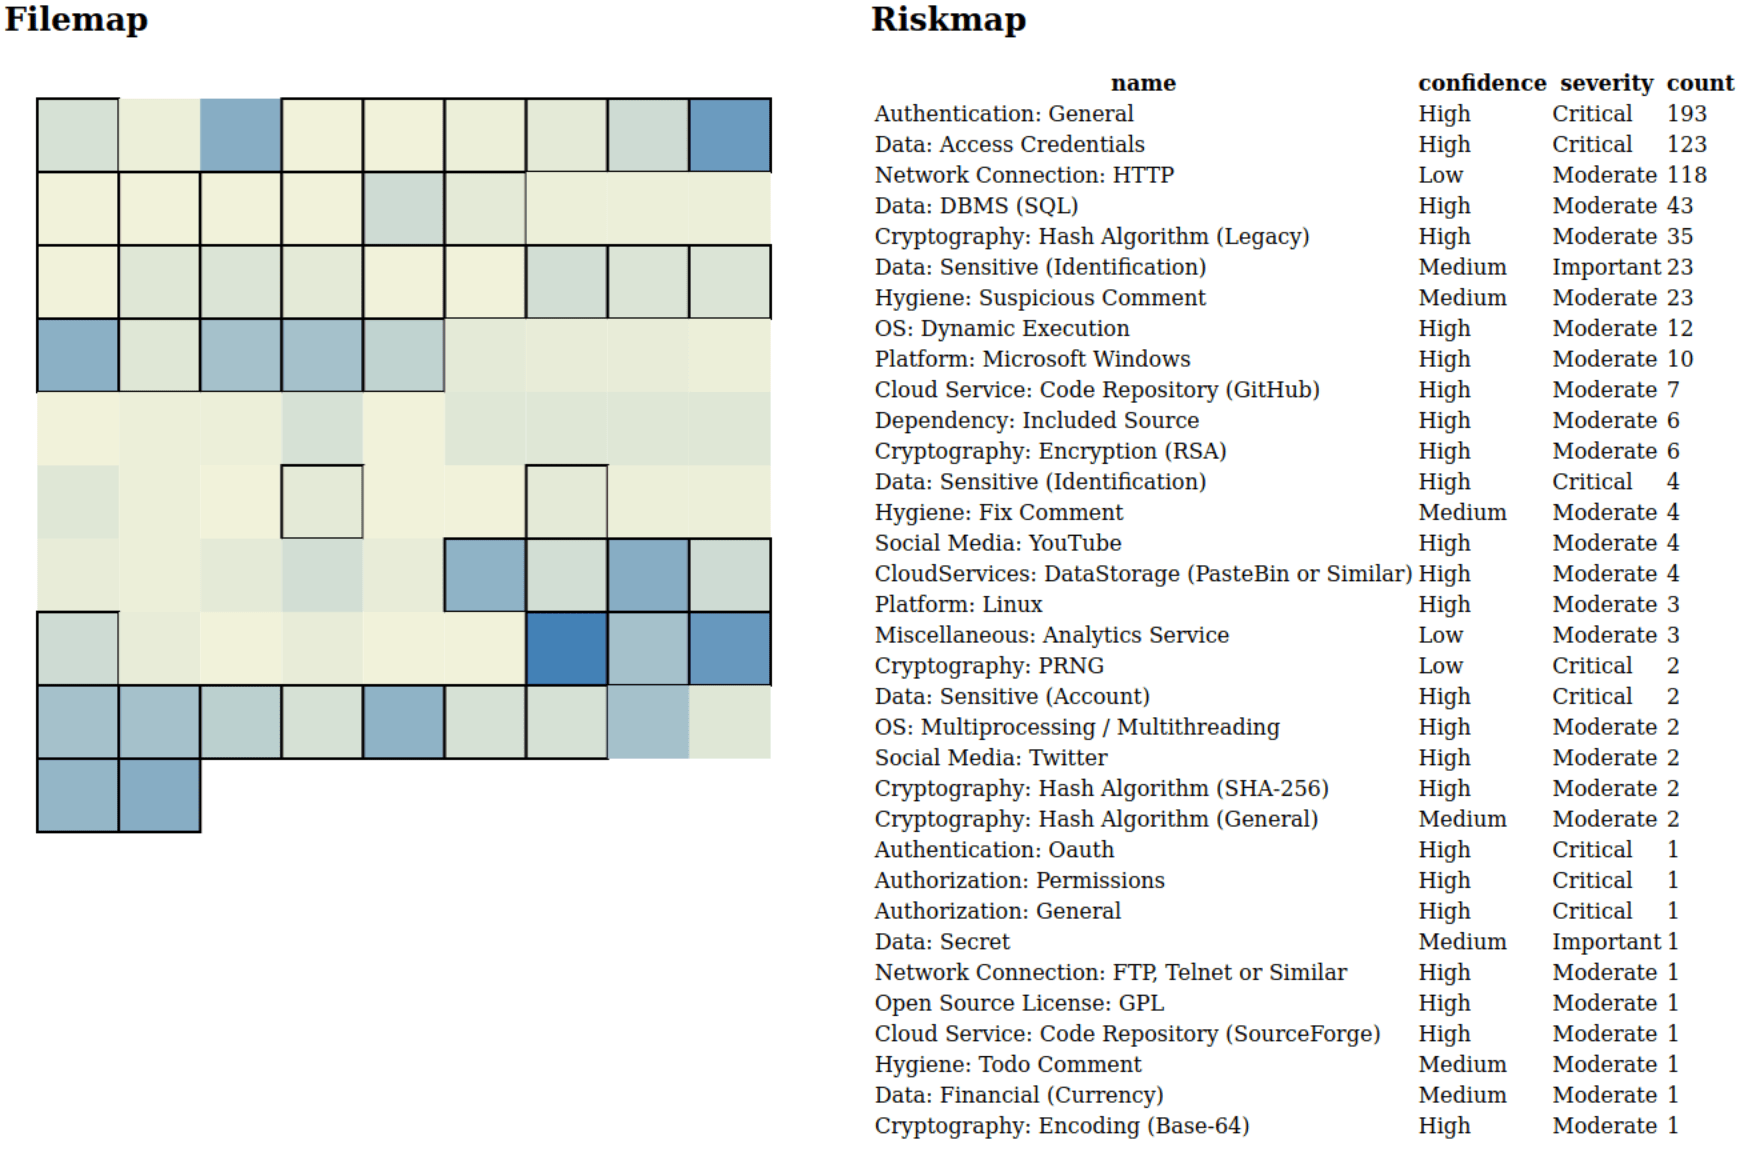
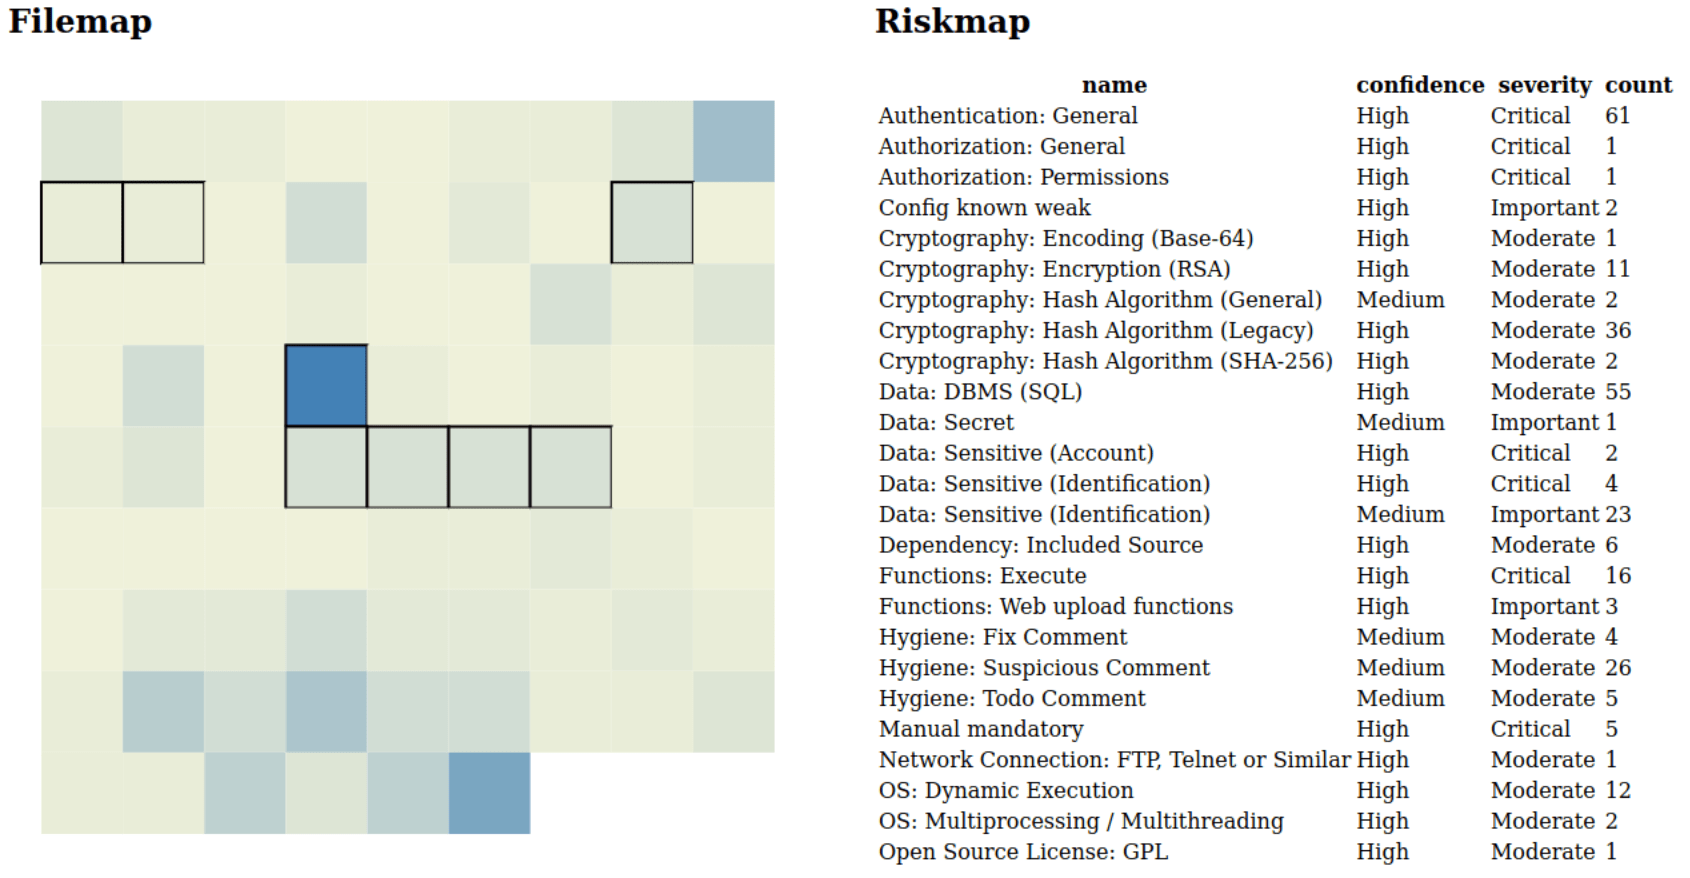
Whereby the visualization of the above items should aid us in determining the location, scattering, and frequency of their occurrence. Let’s have a look at a default run of Microsoft Application Inspector on the DVWA codebase:
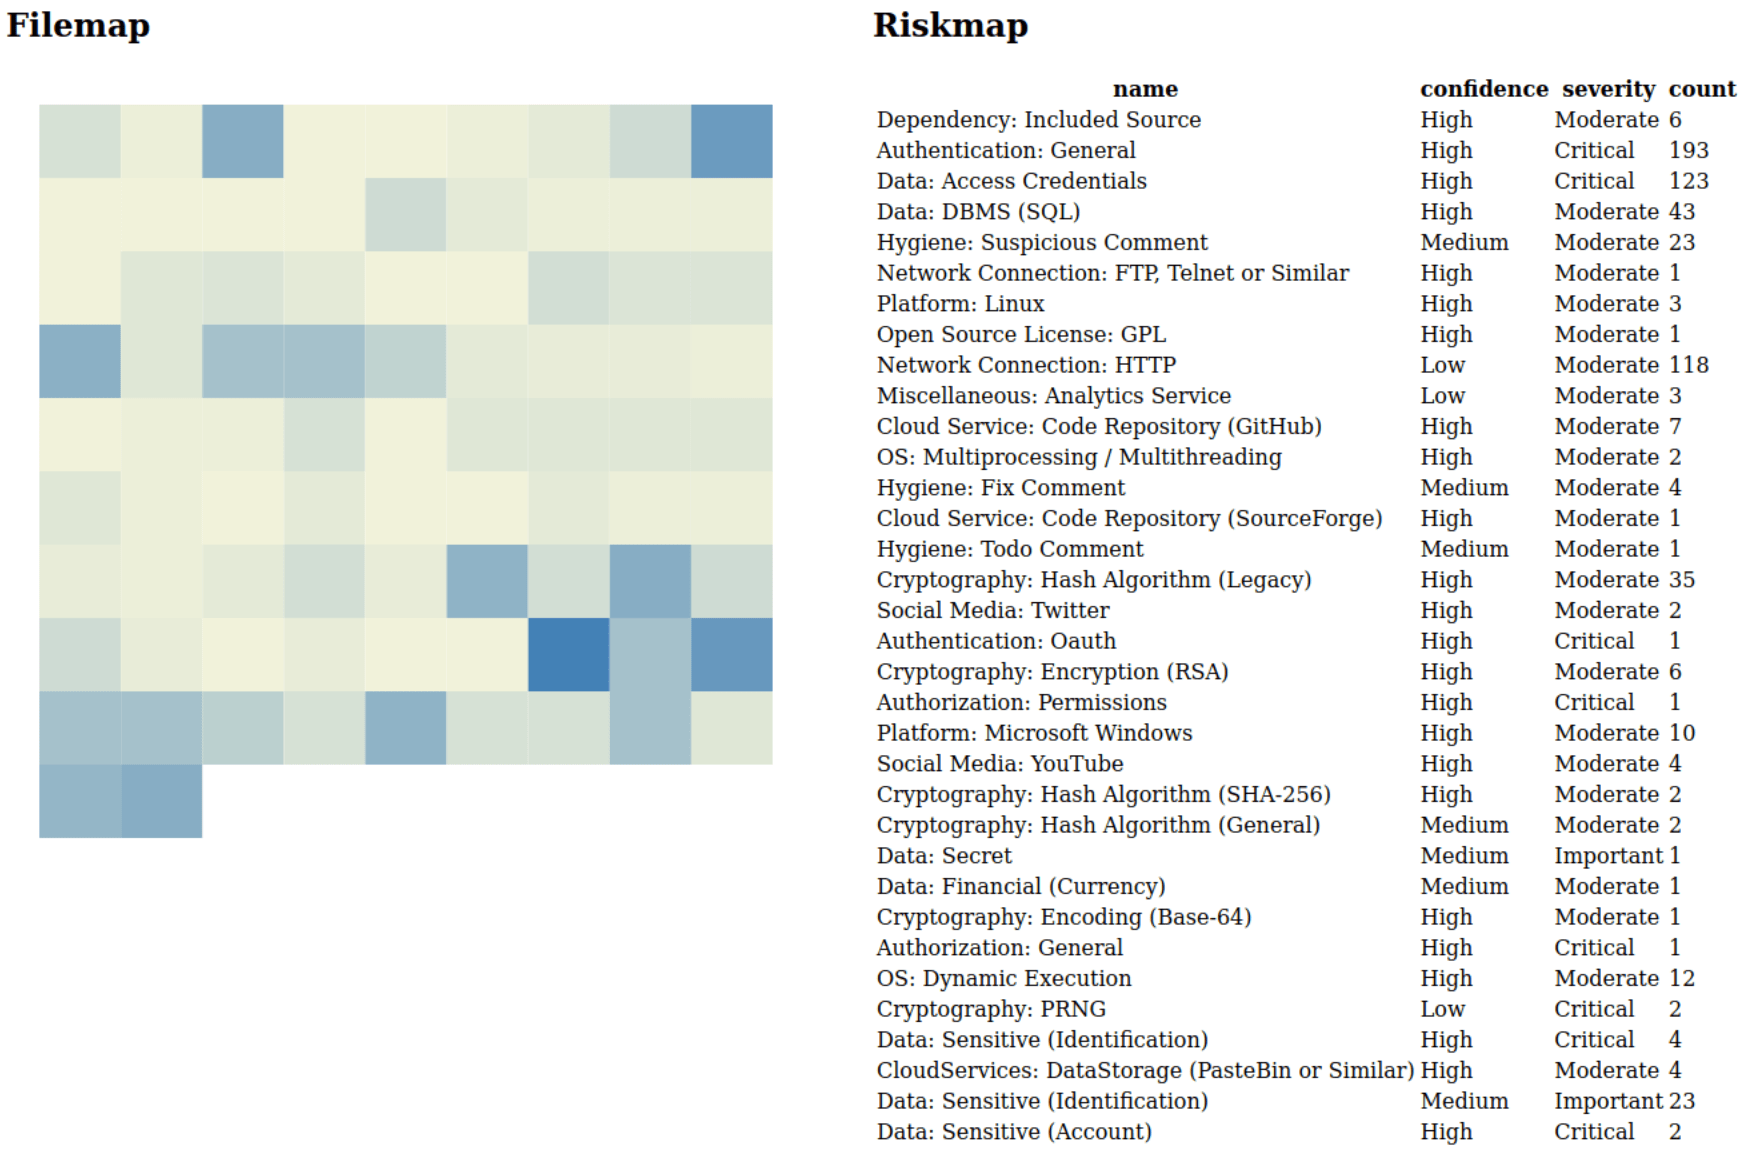
The above image has been generated with code written by Anne (@A_Postma), after which she patiently explained to me how it works to enable me to further tinker with it. While brainstorming with her we realized that codebases could be very large, thus some kind of a pixel map would be beneficial to keep the overview. Especially if we are only after a guesstimate of the risk.
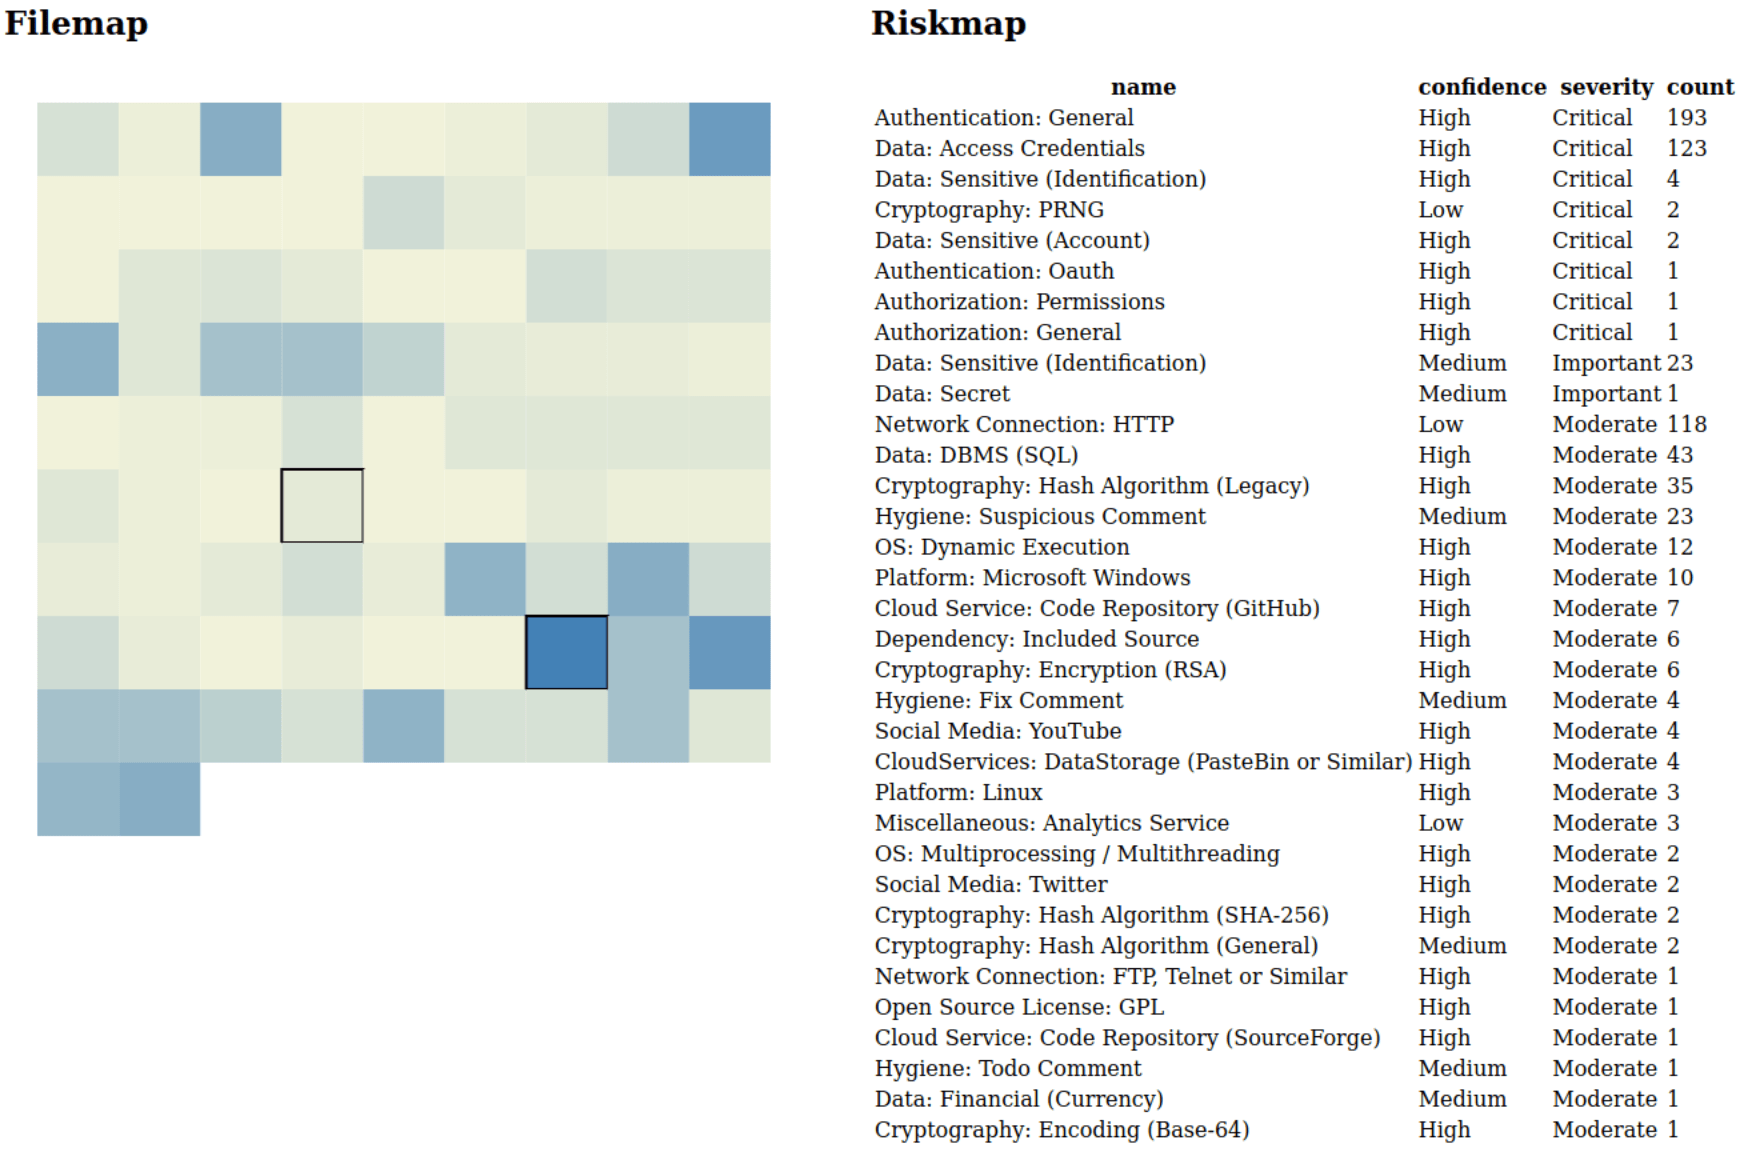
The code colors represent how often a file has been hit with rules. On the right side, there is an overview of all the rules that have hit on the codebase. This table can be clicked on the headers, thus allowing sorting. Also when you hover on one of the rectangles it displays the filename and the rules that specifically apply to the file. So we could for example sort on the severity and select let’s say “Cryptography: PRNG”:
Regardless of the rule quality, to which I’ll get later, this overview enables us to for example understand if there are many rules that apply to this code base, what these rules are and if they are concentrated in the codebase. The interpretation if this is bad or not is left to the human. You can, for example, start to explore the low-hit files or maybe more intuitively the high-hit files.
If we really want to see the impact of visualization we could for example also select a rule which has a high-hit count:
Like you can imagine, regardless of hit count, due to the way the underlying technology works, there are false positives involved! This is only the first run, what happens when we codify our knowledge after the code review? After all, the ability to transfer a guesstimate of code risk to another party or to the owner of the code base is pretty valuable.
Going back to our definition of risk, let’s see how many of the items we are working with in this visualization:
[+] Use of known weak technology
[+] Use of outdated dependencies
[-] Existence of custom code
[-] Known weak configuration
[+/-] Use of dangerous functions
The tricky part is that we as HUMANS have to do some of the interpretation, but the information is present to make a judgment. Technology is present, dependencies are present, custom code is pretty hard to detect which is absent as well as configuration checks. Dangerous functions is an interesting one since there is information on functions present, but dangerous functions are a category of their own IMHO.
Keep in mind that the current pixel map represents only the code that was ‘hit’ by the rules. For an overview of the total of the codebase, you’d have to check the donut visualization already provided by Microsoft Application Inspector
Codifying knowledge
What does this exactly mean? It means for one part tuning the current ruleset to the code base that is being analyzed and for another part adding rules to detect risk that has been identified by the human reviewer. For this blog, I will only focus on tuning current rules and writing some rules for the dangerous functions part. After all, this is just an experiment to learn and assess the viability of this approach to visualize risk as well as transfer it.
Let’s start by making a local copy of the files that resulted in hits in the first place. I’ll use a quick & dirty oneliner:
for i in $(grep -i ruleid xxx.json | cut -d\" -f4 | sort -u); do grep -R $i /home/dev/tools/ApplicationInspector/AppInspector/rules/default/;done | cut -d: -f1 | sort -u > t.txt

for i in $(cat t.txt);do cp $i rules/;done
Now we can tweak those files or remove them to better tune the rules to the code base. As an example for this experiment I just changed the confidence to low and then changed the command to not output items with a low confidence. This is kind of a coarse approach and could be fixed un a much more granular fashion by improving the POC to handle those corner cases interactively.
In addition to writing new rules and tweaking existing rules, there is still one case that remains elusive. What if a certain file is really important, but you’d still like a manual review, just in case? So the quick and dirty approach has been that I’ve defined “//HIT_ME_RISK_MANUAL_MANDATED” and then I’ve created a rule for it (normally would adjust only the output file, not the source code). Which I think is the type of knowledge transfer that you’d need if you want the owner of the codebase or a different party to quickly zoom in on important parts of the code.
Attempt 2: Interactively visualizing risk
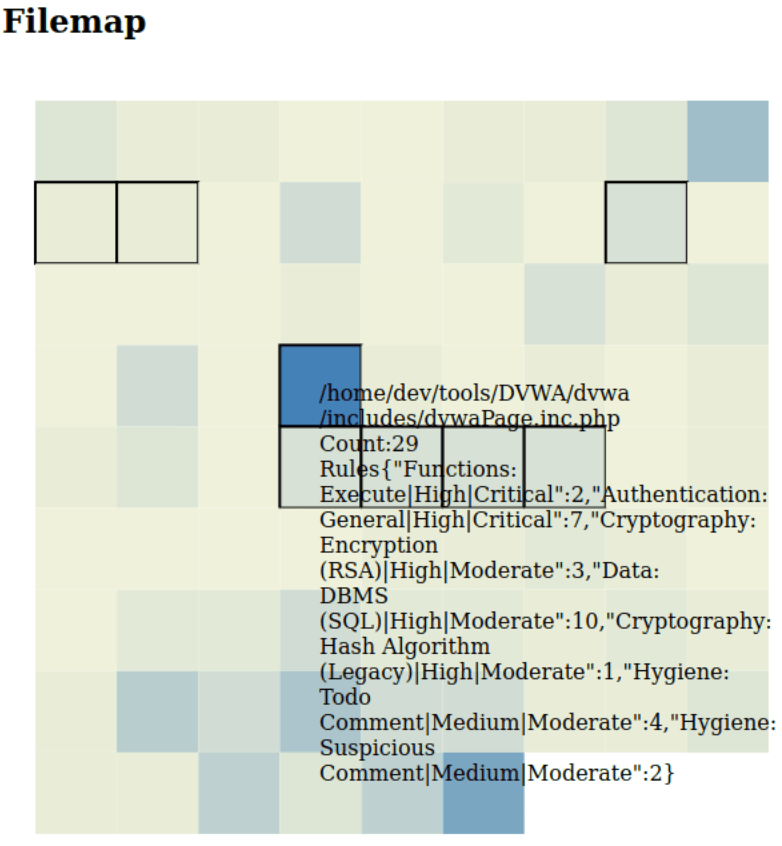
How does the codebase look like after our tuning, creating new rules, and making some files mandatory?
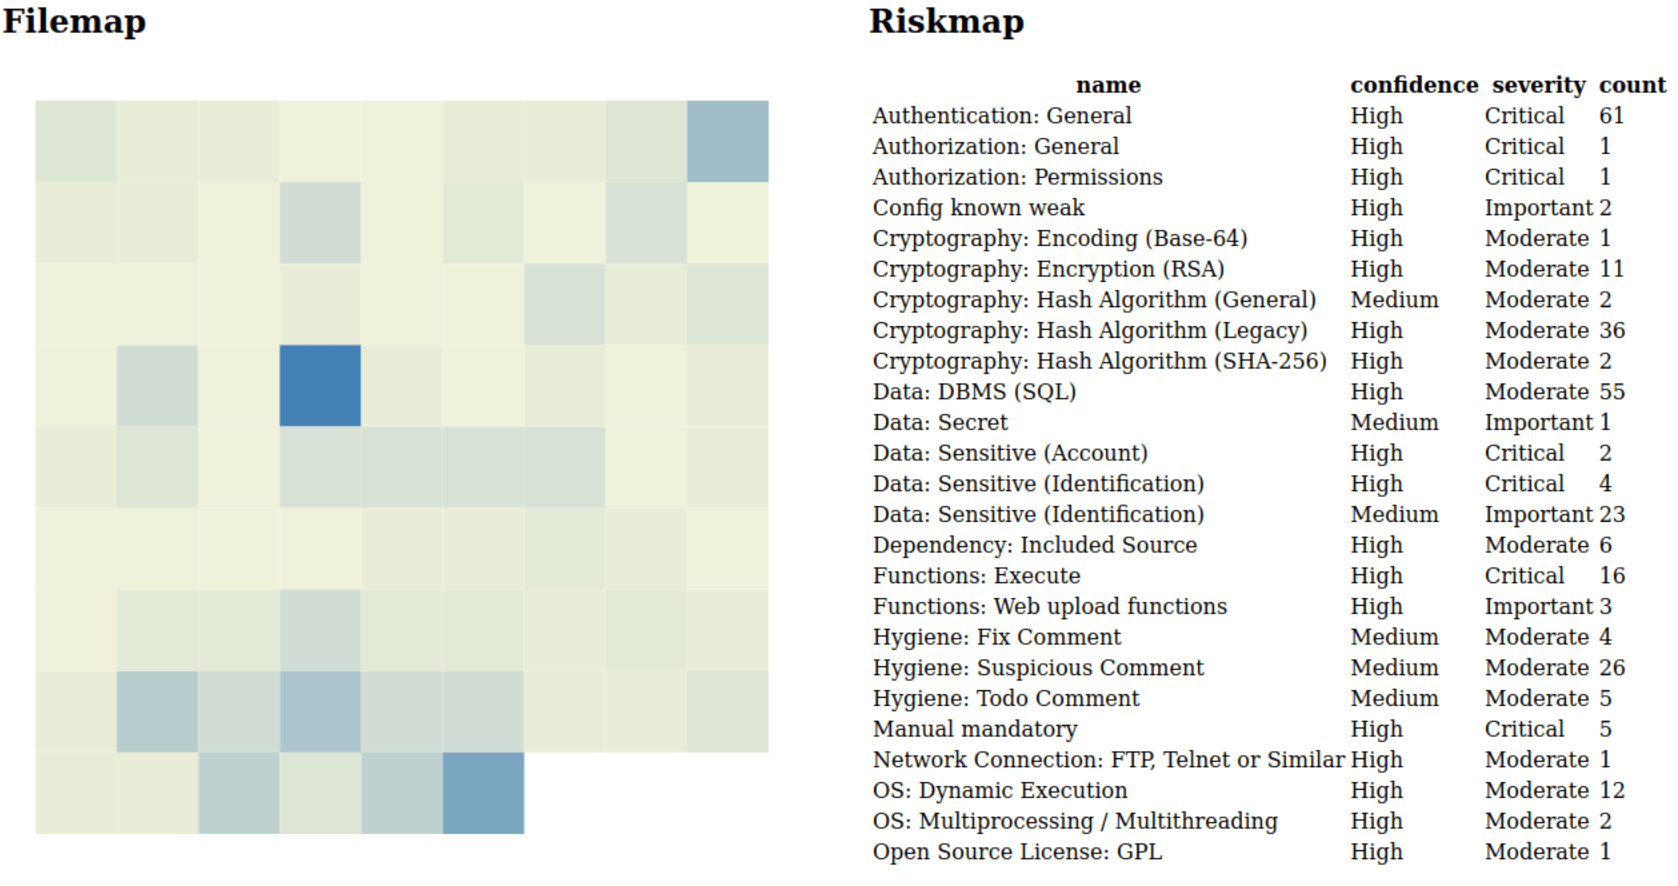
Well, that looks less ‘heated’ right? This might indicate that using ‘rule hit count’ might not be the best metric to draw, the heatmap? If we investigate those hits, we notice that the brightest of them is ‘dvwaPage.inc.php’, which upon further inspection, seems to contain a LOT of code that does indeed pose a risk. So a simple count on rule hits does work*! With the big caveat, that rule quality defines all.
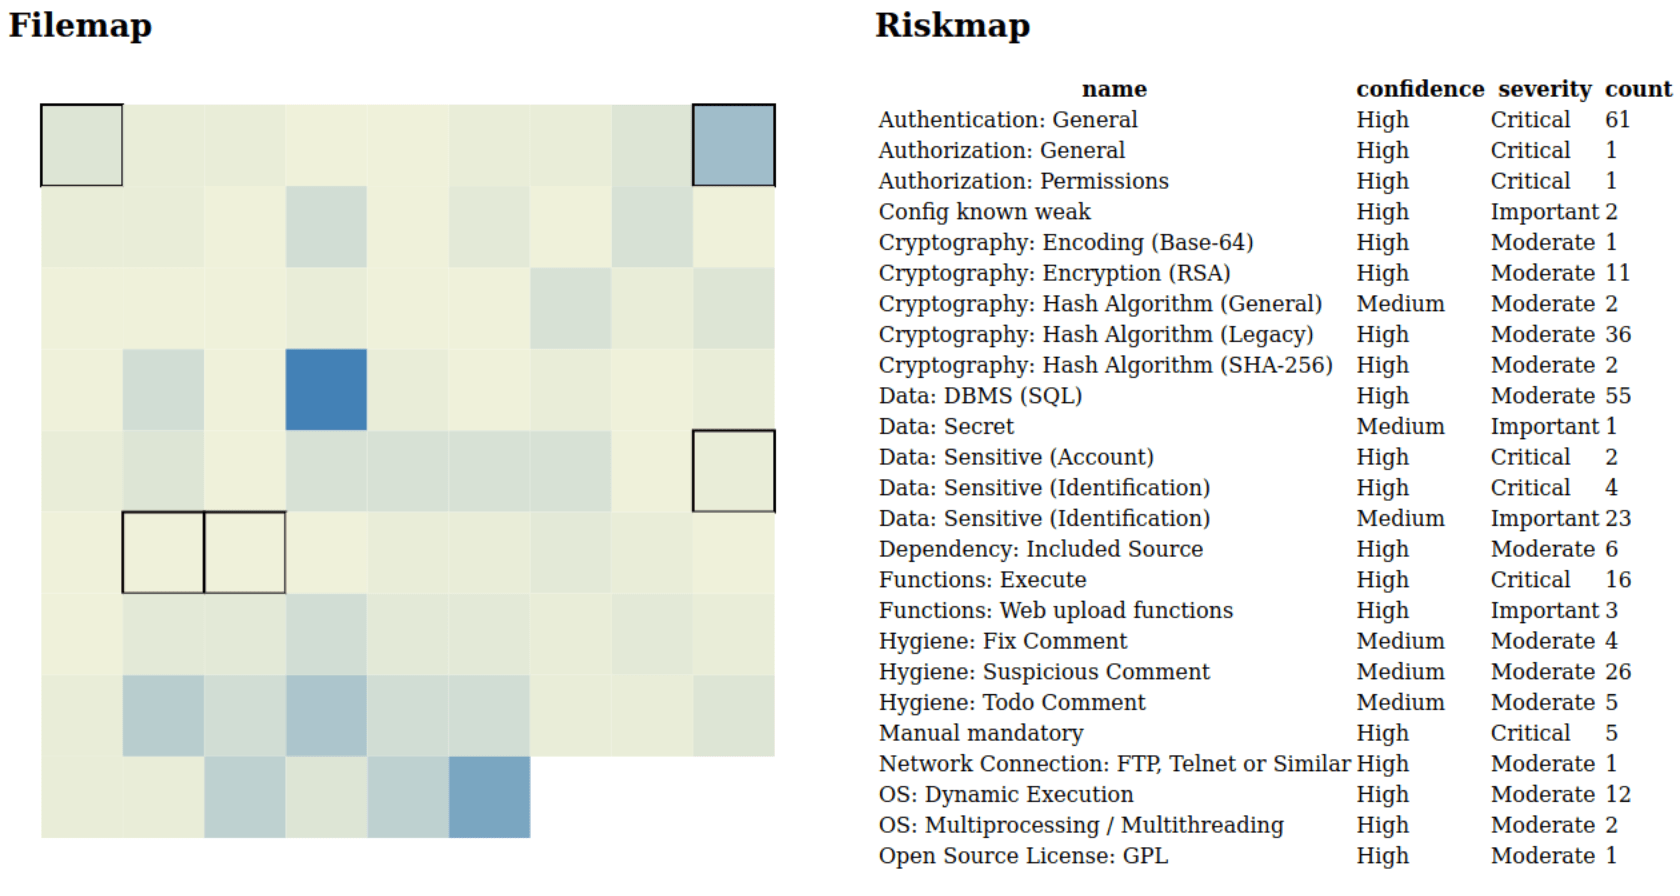
If we select the ‘Manual mandatory’ rule we quickly get a feeling for these files. It seems that some of the files that were marked as mandatory review would normally not trigger our focus?
Lastly, let’s see how our new rules are performing:
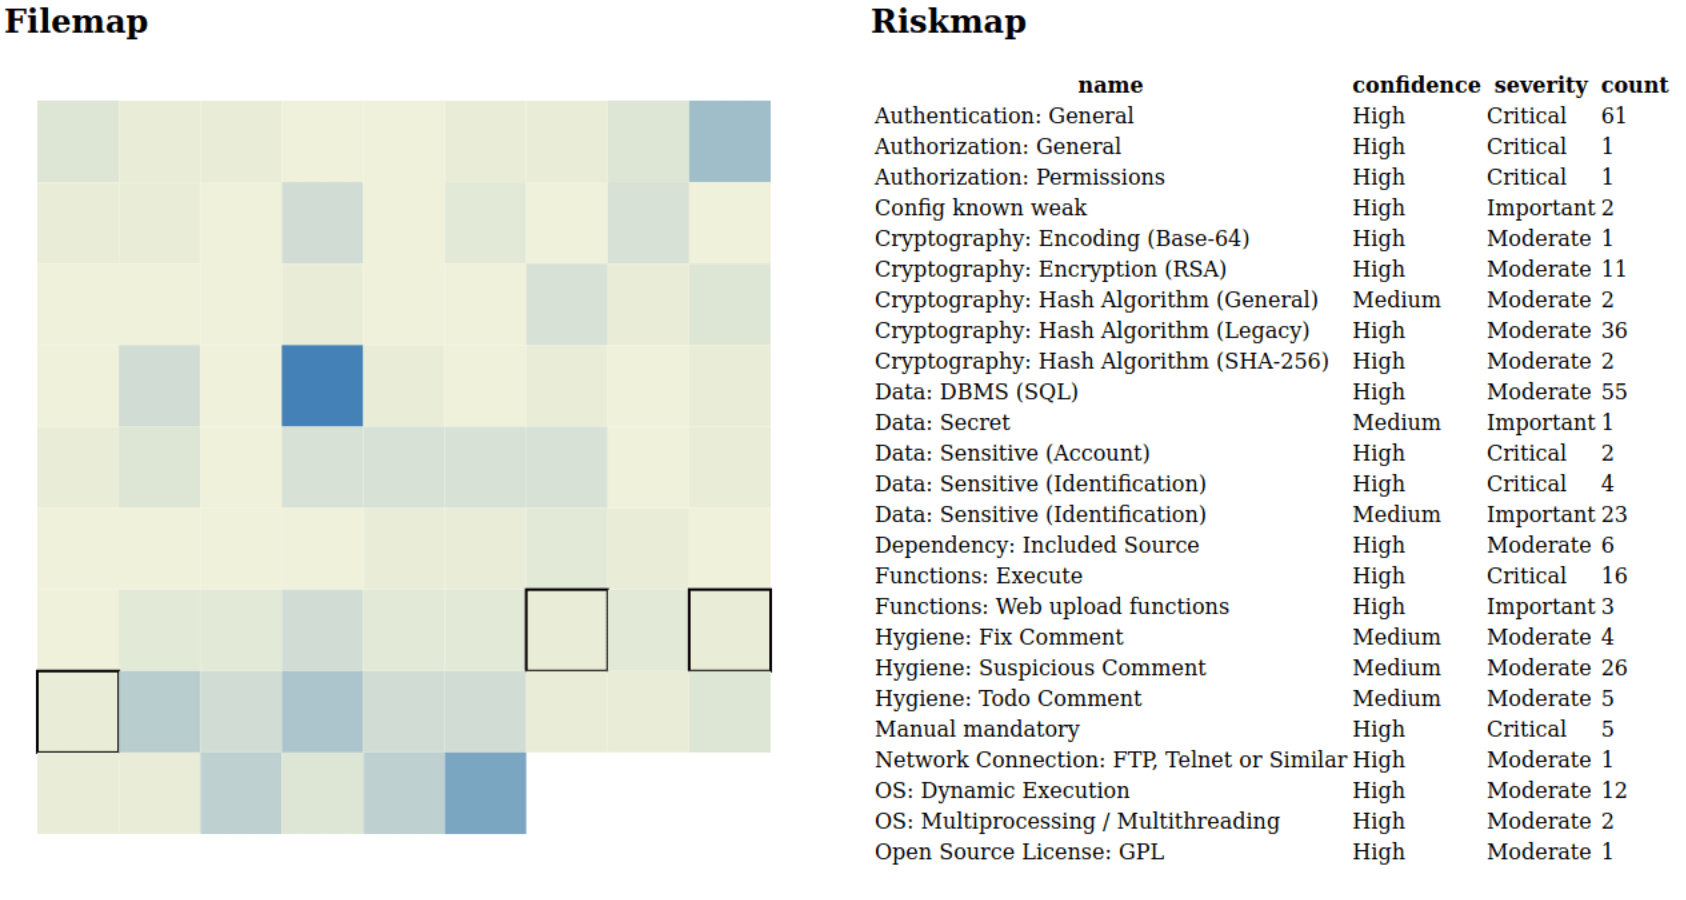
Interestingly the ‘Functions: Web upload functions’ rule is spot on, but the ‘Functions: Execute’ rule seems a tad broad?
Upon further inspection, it indeed seems a false positive, with only two hits (You need the code snippets/source to determine this). The rest is of course what we already knew, this file really combines a lot of functionality which can be seen in the different rules that ‘hit’ it. So how are we doing on the risk item overview?
[+] Use of known weak technology
[+] Use of outdated dependencies
[+] Existence of custom code (dirty hack to force manual review)
[+] Known weak configuration
[+] Use of dangerous functions
You’d almost think we hit a perfect result with the above list. However as stated previously multiple times, getting the rule quality to be precise enough, but at the same be broad enough is very very difficult.
As long as we keep in mind that the goal is a guesstimate this seems to work, I’m just afraid that without proper tooling the tuning of the results on a large codebase might be very time-consuming.
Conclusion
So what can we conclude after all this playing around?
- Visualization is difficult but very useful.
- Microsoft Application Inspector without tuning a good tool to determine components within codebases, but not necessarily risk.
- A tuned ruleset visualizes risk, but at what cost? Will it apply to a new codebase or will the rules be to narrowly focused?
- Fine-tuning in itself is a pretty intensive task. It would benefit from higher quality rules, but that is difficult if you take the broad application of this approach into account.
- The file format used by Microsoft Application Analyzer can also be used by other analysis tools.
- The rules file format, combined with the output file format allows for the transfer of knowledge. Even if we have to include a dirty hack to point to the specific human identified risk that is difficult to describe in a rule.
- The rules can be used like some-kind of security regression test.
In general, I’d conclude that using Microsoft Application Analyzer is a very nice and interesting first step to determine what the codebase contains which allows for some degree of risk estimation, but also the amount of work needed to review the codebase. However, further tuning and custom rule writing is a must-do if we really want to capture the knowledge of the reviewer.
The ability to write project-specific rules and have them transfer back to the code owner or a different review party is very, very nice. This really allows for knowledge to build, instead of having to be re-build with every new party looking at the code.
In the end, I think I learned, what a lot of people already knew, Microsoft Application Analyzer is a nice start. To make it even more useful you’d need to develop an application around it to enable fast rule tuning for the codebase.
All in all, it was a fun experiment and I’m less scared of D3 ;)

One thought on “[Part 2] Interactive and transferrable code risk visualization”