The benefits of being exposed to new subjects are that you tinker with them and start experimenting. Hopefully, this blog leads to some new ideas or at best revisits some established ideas and attempt to show that a less perfect approach might just work. Also keep in mind I’m by no means an expert in advanced automatic code / data flow analysis.
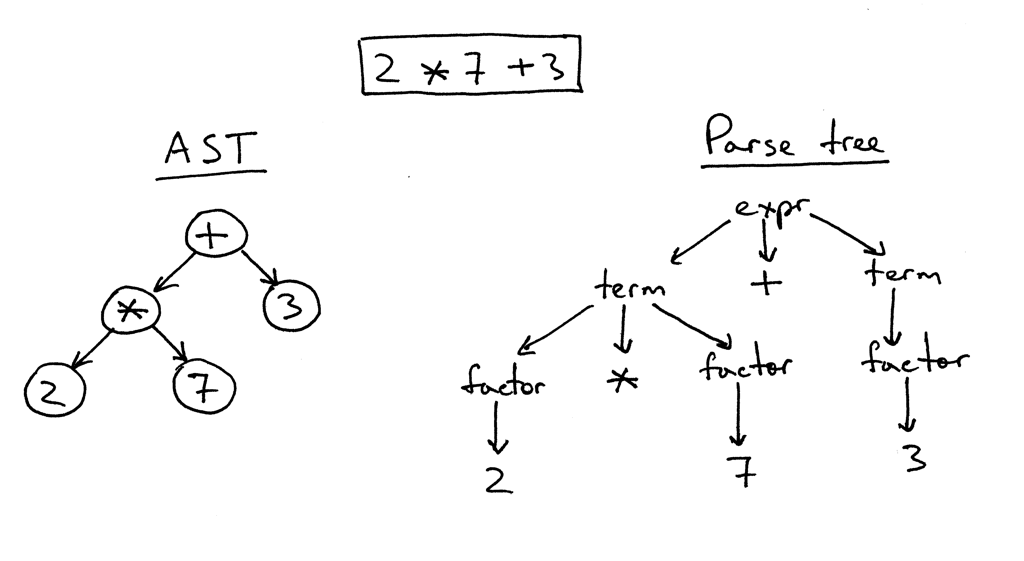
So at my current company, one of our units is doing some pretty cool work with ensuring that security operates at agile speeds, instead of being slow and blocking. One of their areas of focus is the automation of code reviews augmented with human expertise. One of my former colleagues Remco and I got chatting about the subject and he brought me up to speed on the subject. The promising developments in this area (as far as I understood it) concerns the ability to grasp, understand, process the language structure (AST), but also the ability to follow code flows, data types and values and of course lately the practical application of machine learning to these subjects. In a way mimicking how code-reviewers go through code, but using data flow techniques to for example track untrusted (external) input.
What is it good for? That was my first question. Turns out that if you have the above-described ability, you can more easily and precisely spot potential security flaws in an automated manner. It also enables you to create repeatable queries that enable you to quickly weed out security vulnerabilities and detect them if they or variants somehow creep back into the source.
Because just as with regular ‘user security awareness’, an automated and fool-proof process will beat ‘awareness’ every time. Having security aware developers is not bad, but having automated processes and process-failure detection is even better.
However, the above is pretty complex, so I decided to tinker with a less optimal and perfect solution and see what I could do with it. My main goal was to achieve the following:
Enable a guesstimate on what part of a code base could be considered ‘risky’ security wise. Capture the code reviewers knowledge and improve the guesstimate of ‘risky’ parts of a code base.
The above would result in an improved ability to process codebases according to a more risk-based approach, without continuously needing expensive experts. It would however not be fully precise, generation of false positives. The lack of precision I accept in return for the ability to at least have a guesstimate on where to spend focus and effort.
If you are still interested, keep on reading. Just don’t forget that I’m a big fan of: better to progress a bit than no progress at all.
Perfect is the enemy of good
Context details
So what exactly do I want to do? I want to visually represent a codebase as an overview of risky and non-risky parts. This overview by design will not be 100% accurate when the first scan is performed, but will be improved after the knowledge of an expert security reviewer has been added to it. Ideally, this visual overview is portable to enable the owner of a codebase to transfer this knowledge between the different parties that are performing code reviews. In the end, this should become a living companion to the code to continuously have a guesstimate on the current risk of the code.
I hear you thinking, but we have tools and platforms for this! Yes, but they seem to not be very portable and well you need to actually own them (read pay $, which is perfectly fine). My goal is much more to enable code owners to have a coarse overview of risk to enable better and faster decision making. Then the real assessment can be performed with existing tools, and ideally, that knowledge will flow back into that coarse overview.
There is a lot of knowledge loss with current one-off security code review assignments when performed by multiple parties.
Solution proposal
Since Microsoft Application Inspector was introduced I’ve been charmed by it. The reason being that it does not try to be smart, it just tells you what is there, as best as possible. The actual verification is left as an exercise to the human. Let’s visualize what the Microsoft tool does, from my current understanding:
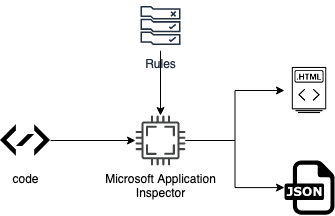 The above results in two pretty nice overviews:
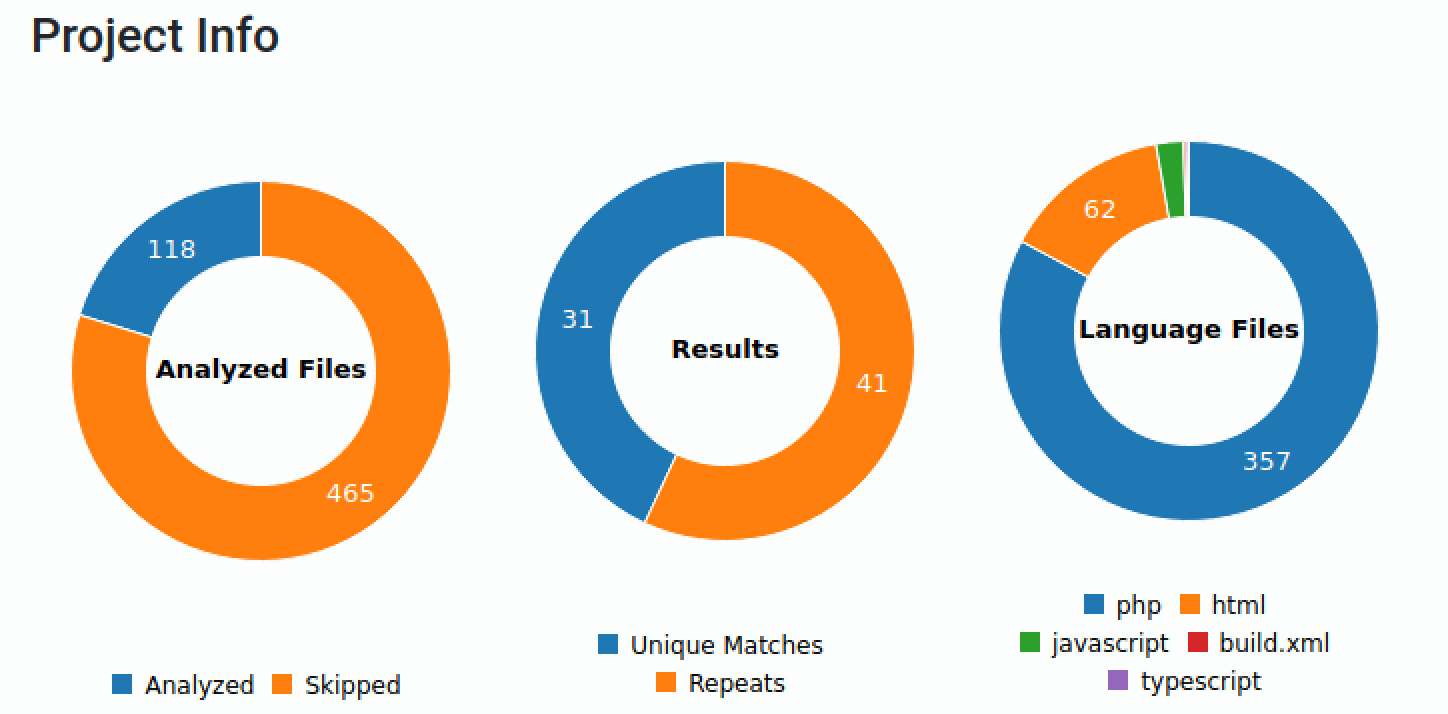
The first overview shown above displays how many files have been analyzed as well as the number of unique matches. It also quickly provides an overview of the type of files that you could expect. In a sense, this already gives you somewhat of an understanding of what you are dealing with.
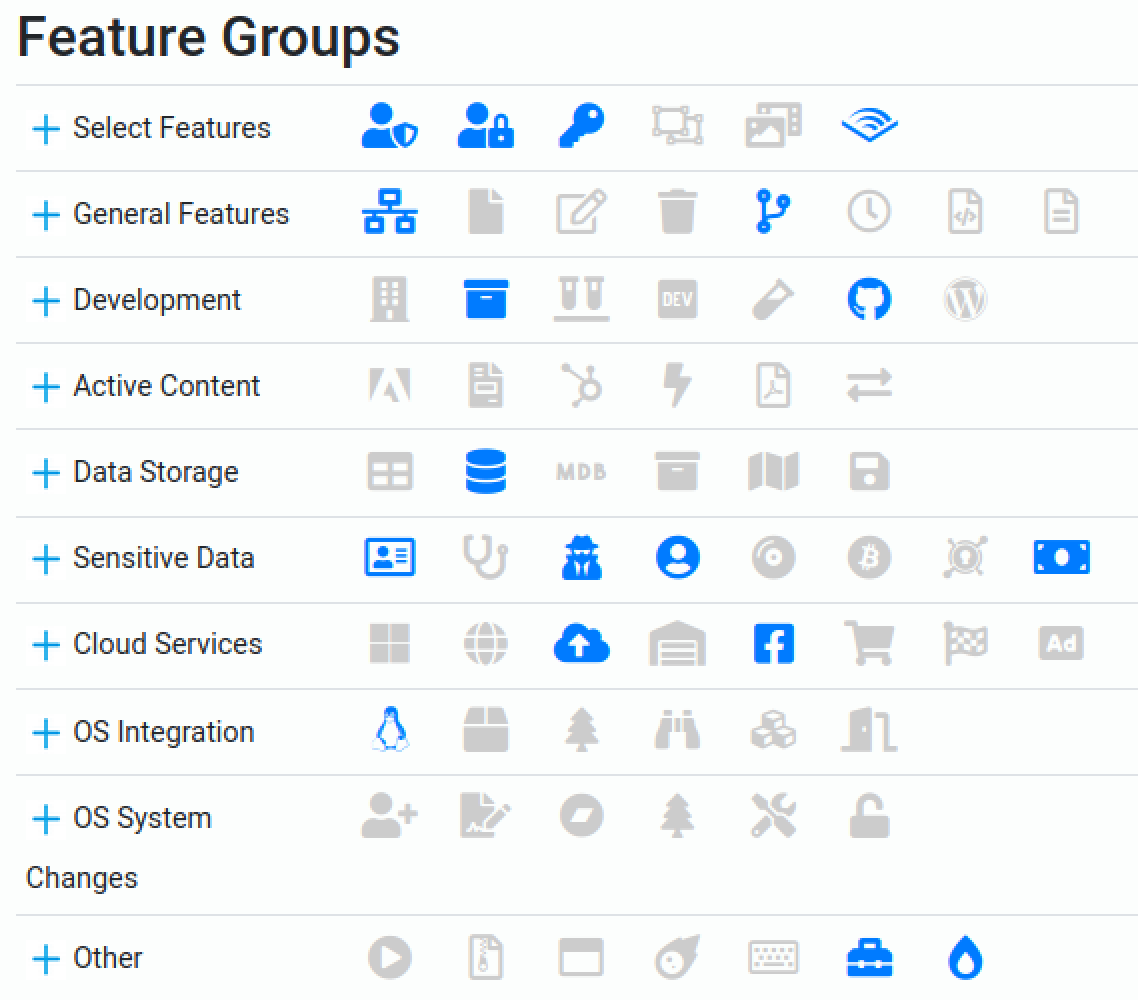 The second result, shown above, concerns an overview of the identified features. This allows you to further drill into the code base up to the level of snippets of code and line numbers. Based on the above image you can gain an even better understanding of what you are dealing with.
The things that most interest me from this approach are:
-
-
- Portable file format (JSON)
- Includes rule tagging
- Includes confidence per rule
- Rules are extendable
-
The rest of the information, while useful, only complicates matters. Things like line numbers, code snippets are the type of information that distracts you from a risk overview into more of a vulnerability hunting mindset.
Now if we extend the current process with human knowledge we would end up with more generic and project-specific rules that would capture the knowledge gained during the code review process. If we visualize the new process it looks like this:
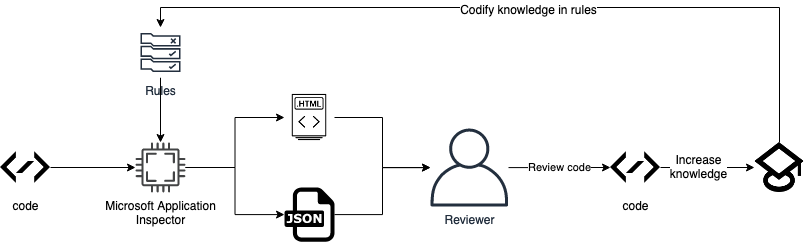 Thus, ideally resulting in transferrable knowledge, that can be continuously applied to evolving code bases. Transferrable because the JSON file, as well as the rules, can be transferred. The rules transfer direct knowledge about potential risks to other parties and the JSON file with appropriate visualizations transfers general understanding. Important to note: that the ‘risk knowledge’ about the code would be codified, not the vulnerabilities themselves. There are other tools out there (like semmle/codeql) in which you can codify the actual vulnerabilities, thus converting them in a sort of security regression tests.
This would enable the owner of the codebase to perform much more efficient risk decisions as well as ensure that new parties reviewing the code can be more efficient. Before you object, no this is not a replacement for continuous (automated or manual) code review approaches. Why then still chase this? Because it helps code base owners which are not there yet.
For the next steps I’ve used the following components and parameters to generate the raw JSON data:
codebase
git clone https://github.com/ethicalhack3r/DVWA
command
dotnet ./AppInspector.CLI/bin/Release/netcoreapp3.1/publish/ApplicationInspector.CLI.dll analyze -d -f json -k external -b -s /home/dev/tools/DVWA/ > raw.json
The choice for the above code was based on the fact that I’m somewhat familiar with it and that it is not extremely complex.
Initial visual experiments
Even though I started manually with d3js (and utterly failed) and then tried vega-lite (went much better) @donnymaasland suggested I try kibana to perform some quick modeling of the data visually, before I further proceed with manual POCs using vega-lite. This turned out to be pretty good advice, since it enabled me to quickly obtain different views on the same data and attempt to reason about it. Here are some examples, based on the generated data:


If you click on the above gallery you can view the images in more detail.
Observations on initial experiments
My first observation is that I’m pretty bad with Kibana visualizations and also don’t seem to have the patience to learn it properly. More seriously though, the above visualizations provide some interesting insights:
The good
The amount of data provided by Microsoft Application Inspector is sufficient to further model, visualize, and reason about a codebase. Since we are leaving out specific details (line numbers, etc) on purpose it lends itself pretty well to be a useful tool to determine a coarse risk estimate of the codebase. Or said otherwise it enables you to transfer and increase insights of the codebase in a very easy manner.
The word cloud quickly provides an overview of tags that are more common to the code base and thus might warrant the attention of a security expert to verify if that technology has been securely implemented.
The tags, when visualized with severity and confidence, enable you to also learn which tags could initially be discarded since they are not severe enough or do not provide enough confidence with the matches.
The files when visualized with severity and confidence of the ‘rule hits’ enable you to quickly spot which files could warrant initial manual inspection. Especially if they contain multiple severe and highly confident hits.
Lastly, when we visualize the rule hits per file and include the confidence we can quickly spot where the risk of our code may reside. Moreso when we take previously gained insights into account.
The bad
First of all the quality of the rules and the correct labeling of the rules in terms of severity and confidence can skew your results and thus the visualizations a lot. This would further substantiate the need for a manual review and the improvement of the rules on a per-project basis. The rules of the project could then be reviewed to generalize if possible.
The amount of data available makes it an interesting challenge to figure out what exactly do we want to know? There are multiple views possible on the data and they should all be taken into consideration to determine the answer we are looking for. Although, I’ve heard that this is a challenge with data visualization in general ;)
Now what?
It would be really wonderful if the potential for this tool would be recognized by more people. This could result in more and better rules to cover a lot of technologies out there. In turn improving the visibility on potential risk, potentially resulting in improved peer reviews or other improved security processes.
I’d say that the next steps would be to think about an interactive visualization to enable the merging of the different views on the data up to a certain extent. Really curious if that will improve or worsen the amount of information that you can extract from the codebase.
In that regard, one of the risks with large codebases is that they might contain all the technology or risk that is codified in the rules. This is why the benefit of a human will for the foreseeable future remain a necessity. It would thus be the human that would prioritize the ‘correct’ risk in regards to the business needs and priorities as well as other threat vectors.
Lastly, I think this tool could also increase the ‘easy wins’ when you are just hunting for bugs in a huge codebase. With the right visualizations, multiple bugs could be identified at once, instead of having to execute a lot of individual grep statements by hand and then scrolling through the textual results. I know I said this tool is intended for a more abstract view, but if you know in which direction (tags & filenames) to look, finding the bug could be substantially accelerated.
Stay tuned for part 2 where I’ll be exploring how I view ‘code risk’ as well as provide an example of an interactive visualization that Anne made for me and she also helped me to better understand how D3 works. I’ve been brainstorming with her on what type of interactive visualization could be useful. The biggest challenge is that I’d like to visualize the entire code base or at least be able to interactively navigate it in a useful manner. You can see how this can become complicated with large codebases.
Finally, I’d like to thank the following people for listening to my nagging, helping me and triggering me with even starting this experimentation:
-
-
- Remco Vermeulen
- Anne Postma
- Donny Maasland
-

One thought on “[Part 1] Experimenting with visualizations and code risk overview”