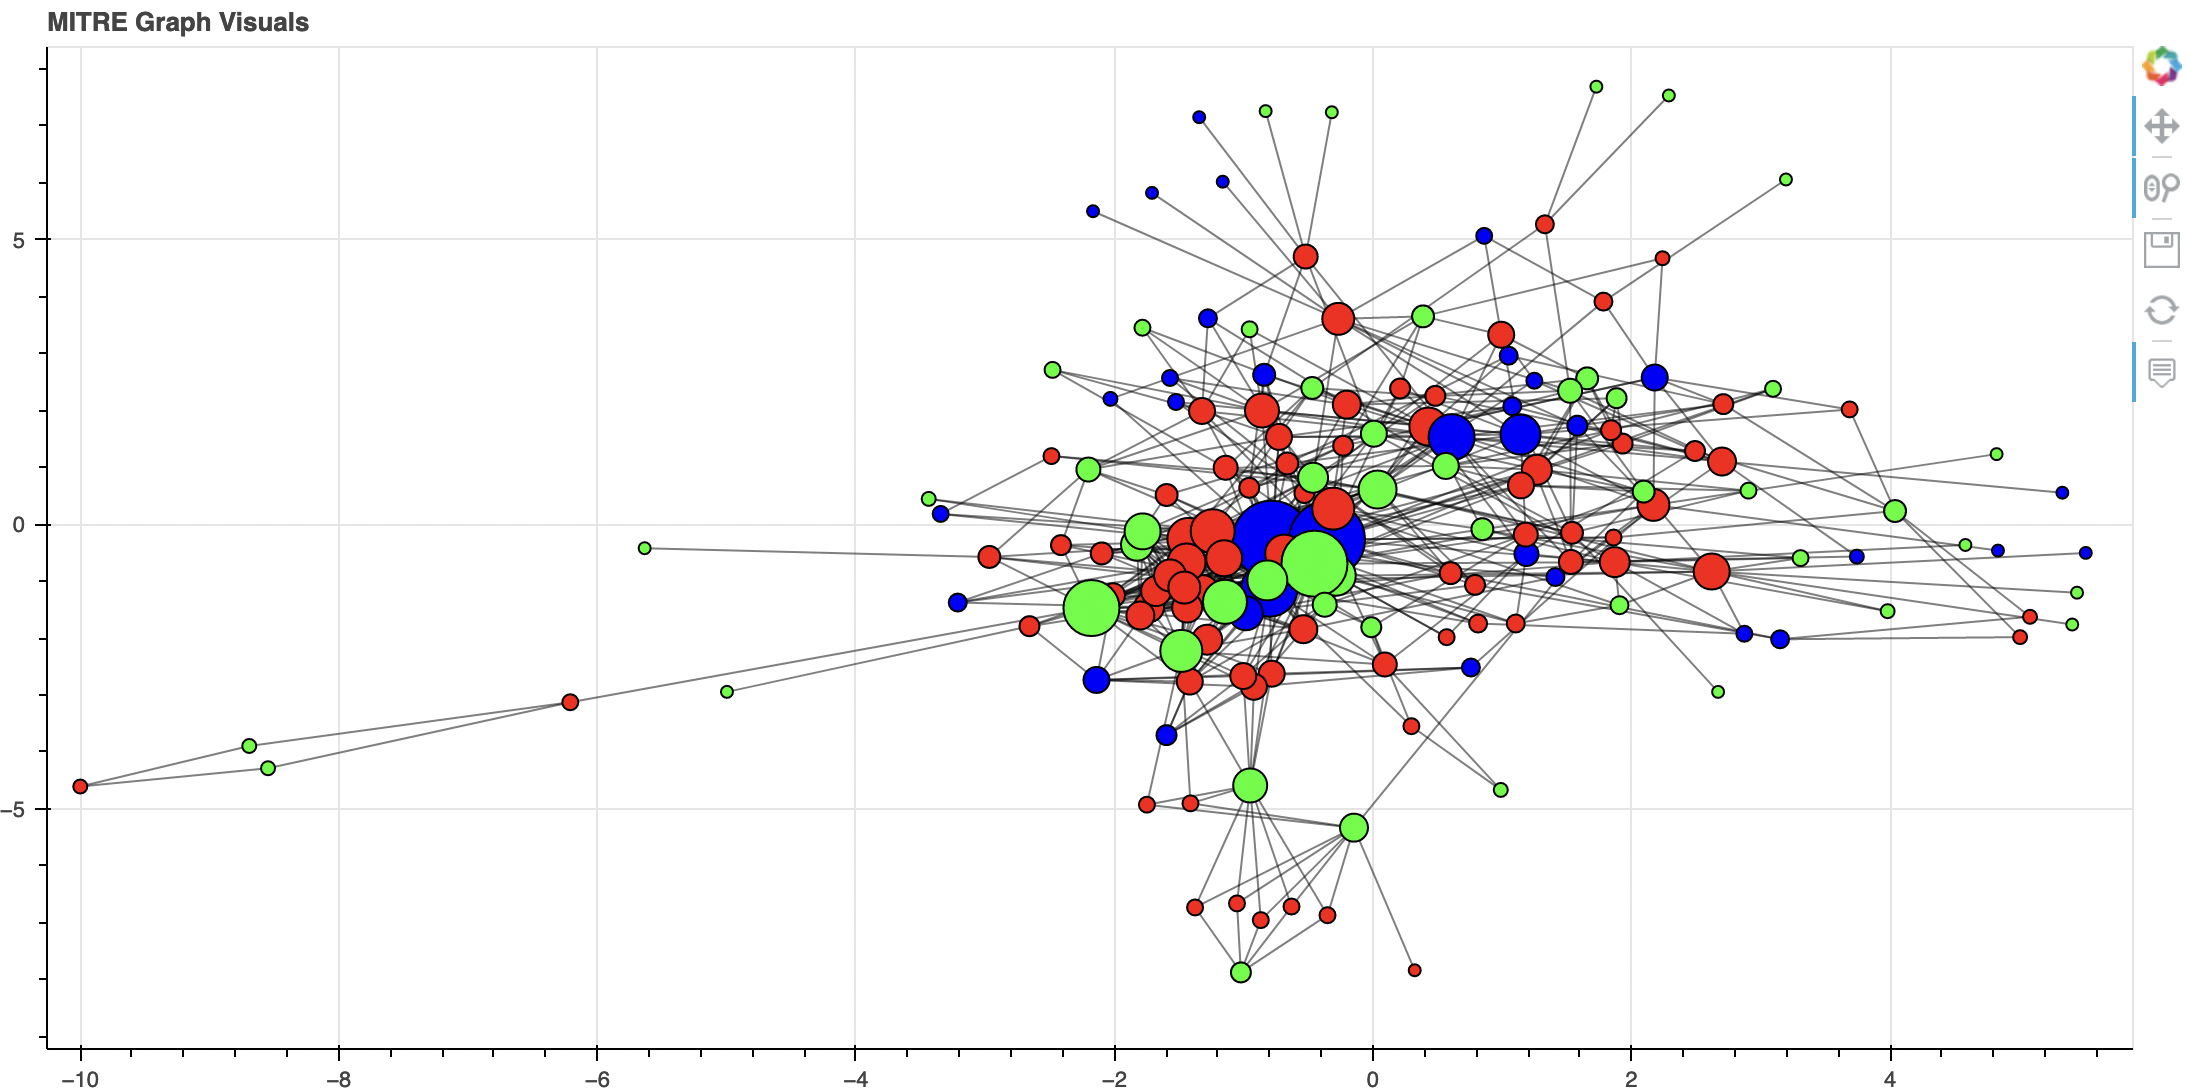
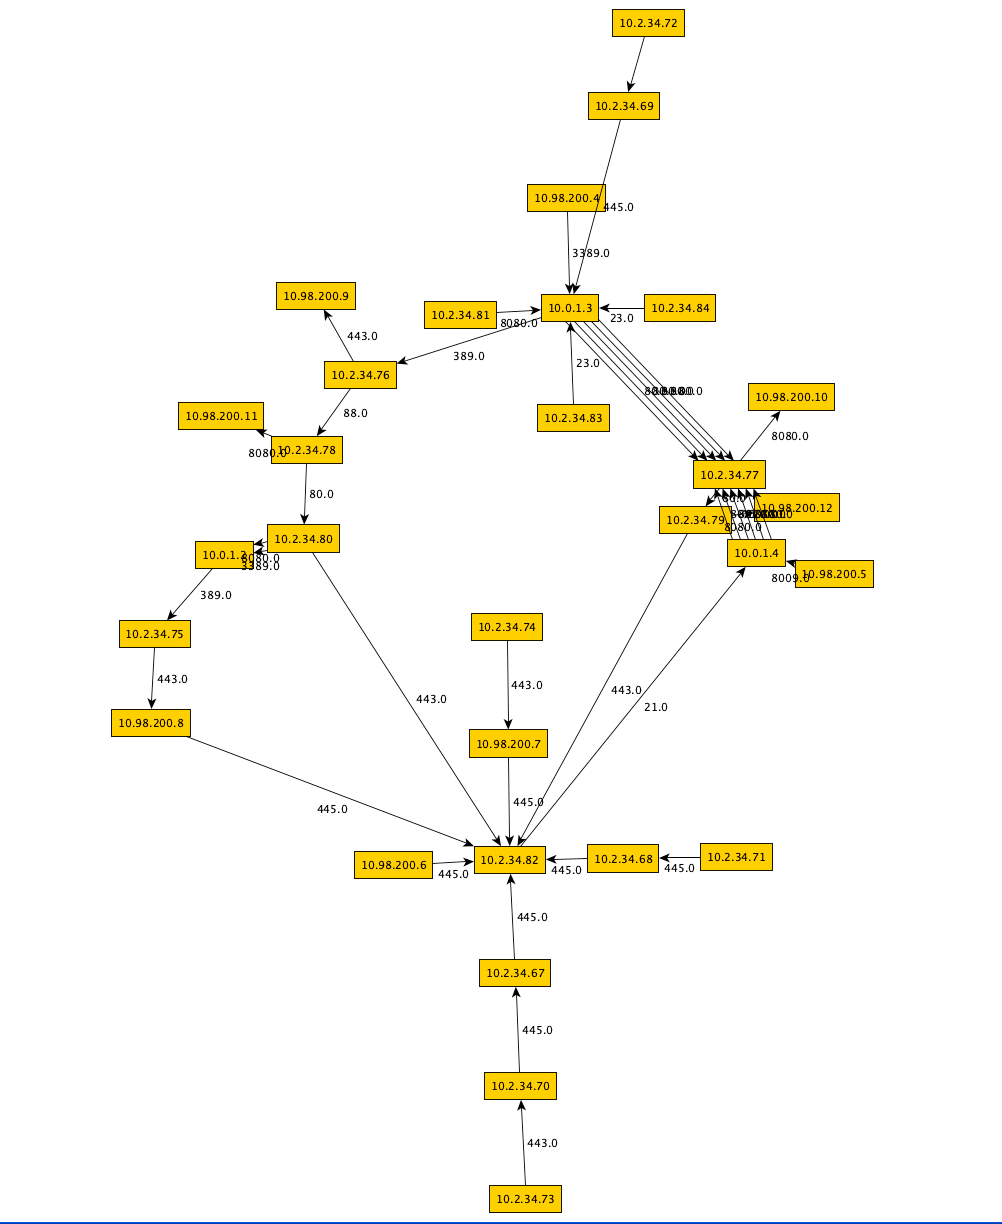
So there I was preparing a presentation with some pretty pictures and then I thought…after I give this presentation: How will the audience play with the data and see for themselves how these pictures were brought into existence?
Finally I had a nice use-case to play around with some kind of environment to rapidly prototype data visualization in a manner that allows for repeatable further exploration and analyses, hopefully with the ability to draw some kind of conclusion. For now I settled to just learn the basics and get used to all these nifty tools that really make these types of jobs a breeze. You can skip this post and directly go the jupyter notebook if you just want to dive into the data/visualizations. The rest of the blog post is about the choices made and technologies used, mostly intended as a future reference for myself.